LCD displays on UPS systems are far from cosmetic. They provide real-time data, fault diagnostics, and load insights that LED-only models can’t match, especially in tender-grade, remote or critical infrastructure setups. For projects requiring visibility, logs or onsite troubleshooting, an LCD is not a bonus feature but a functional requirement.
Introduction
If you’re preparing a tender for a UPS installation in a remote, regulated or mission-critical site, display visibility might seem like a minor detail. But when the system trips, the grid drops, or a field tech arrives after-hours, being able to read clear, local status data matters.
LCD screens on UPS units have become increasingly standard, but are they operationally necessary? Or are LED indicators, remote dashboards, and SNMP cards enough?
In this post, we’ll help you determine:
When an LCD adds measurable value in uptime planning
What LCD vs LED displays show (and hide)
Whether a non-LCD unit may meet compliance needs
What tender clauses typically require for diagnostics and visibility
Whether you’re selecting for a mining shelter, NDIS health site or 5G cabinet, understanding the difference between LED blinks and LCD panels could shape both your maintenance workflow and spec success.
Let’s break it down with real product data and engineering-backed insights.
What Does an LCD Screen Tell You About Your UPS?
UPS LCD panels aren’t decorative. For infrastructure planners and field techs alike, they serve as a primary interface for assessing the UPS’s health and operational state, especially in environments where network tools are unavailable or restricted.
Here’s what a UPS with an LCD panel can reveal:
Battery Health and Charge Level: Live updates on voltage, charge percentage, and sometimes estimated runtime remaining.
Input and Output Metrics: Voltage, frequency, and power factor data help validate site power quality and UPS performance.
Load Monitoring: Displayed as percentages or bar graphs, useful for avoiding overcapacity scenarios.
Event Notifications: Overload, inverter failure, battery degradation or bypass activation (all visible at the front panel).
Ambient or Internal Temperature: Found on higher-end models like the PMU-T and RollUPS, this helps monitor operating safety.
Local Control Access: Touch or button navigation to toggle operating modes, initiate tests or mute alarms (model-dependent).
LCD-equipped units like the XL+, Enduro, CamSecure, and Epower series go further by offering combined LCD + LED visibility that bridges deep diagnostics with fast-glance status alerts.
LED indicators and LCD panels both serve visibility roles in a UPS but they aren’t interchangeable. Each serves a distinct operational purpose depending on the environment, user expertise, and level of oversight required.
Here’s a clear side-by-side:
Feature
LCD Display
LED Indicators
Numeric values (e.g. volts)
✅ Yes
❌ No
Event log access
✅ Yes
❌ No
Fault condition visible
✅ Yes
✅ Yes
Real-time status
✅ Dynamic display
✅ Limited cues
Tender-ready diagnostics
✅ Preferred
⚠️ Limited
When does an LCD screen add value to a UPS?
LCD screens aren’t a bonus feature; they’re often essential for modern UPS deployment. Their presence can:
Reduce downtime
Aid on-site diagnostics
Simplify fault resolution without external software
They’re valuable when:
You need instant visibility: Real-time metrics such as voltage, load percentage, battery charge, and internal temperature are accessible at a glance.
Remote access isn’t feasible: For installations without SNMP, USB, or RS485 connectivity, on-device data becomes the only reference point for service teams.
Event logs and error tracking matter: LCDs in units like the PMU-T, GP Series, and CamSecure provide event logs, battery stats, and load history that support compliance documentation and lifecycle planning.
There’s advanced integration (aircon, bypass, redundancy): Models like XL+ and Enduro integrate multiple functions that require real-time, panel-level visibility, particularly when servicing complex infrastructure.
Example clause: “UPS shall feature front-panel LCD indicating, at minimum, input/output voltage, battery status (%), load level, and logged event history.”
Can LEDs Alone Be Enough for a UPS?
In some contexts, yes, but only when expectations are low and risks are limited.
LED indicators still serve a role where:
The UPS is integrated into a wider SNMP/SCADA system: Diagnostics are handled upstream via software, making LED-only panels like those in Wall-Mount units or Eco 600 viable for auxiliary loads.
Budget and simplicity take precedence: For shelters, remote poles, or NEMA-class cabins, especially those powered by small PV systems, LEDs suffice for “mains OK” or “battery fault” signals.
You need quick-glance alerts, not deep diagnostics: Products like VaccSafe PowerGuard show operating states (green/yellow/red) for basic fault escalation.
Caution: In government or commercial projects where on-site serviceability is mandated, LED-only units may not pass technical compliance. They lack the depth required for maintenance regimes, fault log capture, or performance benchmarking.
How to Choose between LCD UPS and LED UPS for Tenders?
When drafting a UPS spec, visibility is often overlooked, but it shouldn’t be. Whether you’re dealing with a remote comms node or a critical NDIS facility, the type of interface matters.
Here’s how to align display type with your operational and compliance needs:
When to Choose LCD UPS Systems?
You need detailed front-panel visibility: Models like the XL+, Enduro, and PMU-T offer readouts for input/output voltage, battery condition, fault logs, and temperature, all accessible without opening a laptop.
Your project requires runtime analytics or log retention: Systems such as CamSecure and GP Series provide historical logs and real-time metrics, meeting audit, lifecycle, or SLA documentation standards.
There’s no external monitoring (SNMP, SCADA, RS485): For isolated or standalone installs, like solar farms or mining setups, the UPS itself becomes the primary source of diagnostics.
The UPS includes redundancy, aircon, or embedded distribution: Visibility is critical when managing multiple internal components. LCD-equipped units such as the Patriot Modular and Epower Combined UPS make fault tracing faster and more accurate.
When to Choose LED UPS Systems?
Your site has upstream monitoring tools: For example, wall-mount power supplies with LED indicators (voltage presence, output activity) can be used where SNMP or building management systems (BMS) handle event logging.
Budget constraints are strict: Eco 600, Eco 1000, or VaccSafe units are viable when cost is the priority, and only basic cues, like battery active or mains failure, are needed.
UPS is secondary in the system hierarchy: In setups where the UPS is a backup to a larger system, LED indicators suffice for on-site awareness while alerts are handled centrally.
Still unsure which way to go? Submit your tender spec for review and we’ll recommend the best-fit display setup based on your site, load, and compliance requirements.
LCD UPS & LED UPS FAQs
Do all UPS models come with an LCD display?
No. LCDs are typically included in mid-tier and enterprise-grade UPS systems. Entry-level or cost-conscious models often rely solely on LED indicators that offer basic status cues rather than full diagnostics.
Can LCD-equipped UPS systems store and display event logs?
Yes, units like the CamSecure, GP Series, and PMU-T support local log access directly via the front panel. This allows technicians to trace faults or review runtime behaviour without connecting external tools.
Is an LED-only UPS suitable for government or healthcare tenders?
Only in very limited scenarios. Where uptime, compliance reporting, or runtime visibility is required, an LCD becomes essential. LED-only models may be accepted if paired with SNMP modules or external monitoring platforms, but they usually fall short on their own.
Final Considerations for LCD UPS vs LED UPS
LCD displays are foundational for environments where uptime, diagnostics, and remote support matter. From real-time voltage readouts to event log access and battery condition alerts, front-panel visibility plays a direct role in reducing downtime and improving operational response.
That doesn’t mean LED-only models have no place. They’re useful for basic applications, low-risk backup, or where central monitoring systems already provide oversight. But if you’re preparing documentation for a tender, or managing power across remote, industrial, or compliance-sensitive infrastructure, choosing a UPS with a built-in LCD is part of responsible planning.
Resources
Download the UPS Tender Cheat Sheet →
A quick-access reference that outlines common mistakes in energy performance language. Created to support consultants in drafting clear, compliant tender specs.
Submit Your Tender Spec for Review →
Upload your working document, and our engineering team will review it against current best practices for resilience, diagnostics, and lifecycle performance.
Download UPS Specification Template (Word Format) →
Pre-populated wording for runtime, monitoring, and redundancy clauses. Ideal for consultants working on public sector or infrastructure-based UPS submissions.
Hot-swappable batteries in UPS systems enable battery replacement or maintenance without interrupting power to connected loads. This design supports higher uptime, safer servicing, and minimal operational disruption, making it beneficial for hospitals, data centres, and tendered projects where continuous availability and ease of field service are non-negotiable.
Introduction
For critical infrastructure tenders (whether in healthcare, local government, or industrial automation), battery replacement can’t mean downtime. That’s where hot-swappable battery architecture becomes non-negotiable. It allows batteries to be removed and replaced without powering down the UPS or transferring load to mains.
Hot-swappability is both a maintenance convenience and a safeguard against costly interruptions in environments that demand continuous availability. Many procurement teams overlook this until a site visit or compliance audit flags the risk. If uninterrupted uptime is part of your operational mandate, your UPS architecture needs to reflect that.
Hot-swappable UPS batteries are designed for non-disruptive replacement. Their configuration allows technicians to change battery modules without powering down the UPS or interrupting supply to connected loads. This is vital for environments where even a momentary outage is unacceptable.
How Do Hot-Swappable Batteries Improve Serviceability?
Hot-swappable battery architecture reduces service-related downtime. Batteries can be replaced during regular operating hours without triggering failover systems or needing scheduled shutdowns. For field teams, it translates to faster maintenance cycles and lower site disruption.
Where Are Hot-Swappable Batteries Required in Tenders?
Tender documents for hospitals, emergency response sites, and mission-critical industrial locations don’t always name “hot-swappability” outright, but the intent is often there. Watch for phrasing like:
“maintain uptime during servicing”
“maintenance without load interruption”
“no interruption during battery replacement”
“field-replaceable energy modules”
“battery replacement without system shutdown”
These clauses signal the need for systems where batteries can be replaced without powering down the UPS or load.
What Are the Operational Benefits of Hot-Swappable Batteries?
By enabling live-swaps, these UPS designs:
Prevent forced downtime during battery servicing
Support predictive battery maintenance and lifecycle planning
Reduce emergency service costs and risk
Improve MTTR (Mean Time To Repair) without compromising SLA commitments
Where Are Hot-Swappable Batteries Used?
Common project types that require or benefit from hot-swappable UPS architecture include:
Healthcare sites with ICU, labs, or digital imaging reliance
Water, wastewater and SCADA Systems
Council-operated emergency response and coordination facilities
Edge and remote industrial locations
Transport infrastructure
Tier III/IV data centres or critical communications hubs
In these scenarios, the cost of shutting down to service a battery outweighs the premium for a hot-swappable solution. Hot-swappability ensures that battery management never becomes a single point of failure in your availability planning. Field serviceability isn’t just operationally beneficial; it can be a compliance issue.
Always cross-check tender language against your product’s maintenance protocols. If your UPS solution involves tools or shutdowns to change batteries, it may fall short of the expected serviceability standard.
What Happens When a UPS Doesn’t Have Hot-Swappable Batteries?
When a UPS doesn’t allow for hot-swappable battery replacement, servicing becomes a high-stakes operation. The system must either be shut down or transferred to a manual bypass, which introduces risk, especially in critical infrastructure where power continuity cannot be compromised.
Can Battery Maintenance Cause Unplanned Downtime?
Yes. Without hot-swappability, routine battery changes often require downtime windows, forcing maintenance to be scheduled after hours or during operational lulls. This adds pressure to support teams and introduces risk if failures occur outside of these windows.
What Are the Compliance Implications in Sensitive Environments?
In healthcare, emergency services, or critical municipal facilities, tender compliance often requires that no single point of failure (including battery maintenance) can interrupt power. Non-hot-swappable designs may fall short of regulatory expectations or jeopardise accreditation audits.
Why Is Manual Bypass an Incomplete Solution?
While manual bypass systems offer a workaround, they are not a true solution. They require trained personnel to engage the bypass safely, and they still pose a risk to connected equipment during the switchover. Hot-swappable designs eliminate this vulnerability entirely.
What’s an Example of Failure Impact?
Consider a hospital ICU relying on ventilators and imaging systems. If a UPS battery must be replaced and the unit lacks hot-swappability, even a brief interruption could endanger patients or corrupt clinical data. This is precisely why such specifications exist in medical tenders.
What UPS Models Support Hot-Swappable Batteries?
Three systems in our portfolio are engineered with hot-swappable architecture. For infrastructure planners and tender consultants, this feature is a non-negotiable requirement tied to continuous availability clauses.
3/1 Phase Modular UPS System: Modular plug-and-play battery modules for rapid replacement in industrial and security installations.
3/3 Phase Modular UPS System: High-capacity UPS with parallel operation and hot-swappable modules—ideal for data centres and medical facilities.
Patriot Modular DC UPS: Rack-mounted rectifier units, hot-swappable and redundant, purpose-built for telecom and utility-grade environments.
Hot-Swappable UPS Comparison Table
Model
Hot-Swappable Design
Typical Applications
Scalability
Runtime Options
3/1 Phase Modular UPS
Plug-and-play
IT racks, industrial, security
High
EBXL compatible
3/3 Phase Modular UPS
Plug-and-play
Medical, mining, data centres
Very high
EBXL compatible
Patriot Modular DC UPS
Rectifier-based
5G base stations, utilities
Modular DC racks
Configurable battery banks
All three systems are supported by advanced monitoring and battery management interfaces, so they are suitable for high-availability sites where uptime cannot be compromised.
Hot-Swappable Battery FAQs
What does hot-swappable mean in a UPS system?
A hot-swappable UPS allows batteries or power modules to be replaced or maintained without powering down the connected load. This ensures uninterrupted protection, even during servicing, critical for environments with strict uptime and safety requirements like hospitals, data centres, and government facilities.
Why do hospital tenders require hot-swappable UPS batteries?
Hospitals operate under stringent continuity standards. Any interruption to power during maintenance, especially in areas supporting life-critical systems, can result in compliance violations or operational risk. Hot-swappable batteries allow field service without affecting the load, aligning with both regulatory and patient care standards.
Are all modular UPS systems hot-swappable?
Not all modular UPS units support live-swappable components. Some may offer modularity in form but still require a system shutdown for maintenance. Products like the 3/1 Phase Modular UPS, 3/3 Phase Modular UPS, and Patriot Modular DC UPS from PSS Distributors are engineered for true hot-swappable operation, confirmed by design features and documented technical specifications.
Final Considerations for Hot-Swappable Batteries
When the stakes are high, be it in hospitals, data centres, or critical industrial operations, tender evaluators look for solutions that reduce downtime without increasing service overheads. Hot-swappable battery systems directly address this need. They enable safe, on-site battery replacements with zero disruption to the load, removing the risk of unplanned outages during maintenance windows.
If you’re preparing a submission and unsure whether your site warrants hot-swappable infrastructure, PSS Distributors is here to help.
Resources
Download the UPS Tender Cheat Sheet →
Covers the top 10 pitfalls engineers and consultants make in UPS tender specs. Created to support clear, standards-aligned documentation.
Submit Your Tender Spec for Review →
Upload your draft, and our technical team will advise if it meets performance, compliance and operational benchmarks.
Download UPS Specification Template →
Pre-filled with editable clauses for runtime, battery, diagnostics, and redundancy. Built for procurement officers and consultants.
N+1 redundancy in a UPS system means there is one extra power module beyond what’s needed to support the full load. If one module fails, the system still delivers uninterrupted power. 2N redundancy duplicates the entire system for full failover. Modular designs allow scalable, hot-swappable redundancy, essential for hospitals, data centres, and critical infrastructure.
Introduction
When you’re writing tender specifications for critical infrastructure (a hospital ICU, regional data centre, or transport signalling hub), redundancy is a compliance matter, a duty-of-care requirement, and a business continuity safeguard. In UPS architecture, redundancy refers to the deliberate inclusion of extra power capacity to ensure continuous operation even when part of the system fails.
PSS Distributors works closely with engineers and procurement teams to help them specify the right redundancy model (not just the most expensive one) based on risk class, load criticality, and service availability requirements. This guide breaks down the different redundancy strategies, from N+1 to 2N and modular parallel systems, so your UPS specification delivers on uptime, compliance and value.
What Is UPS Redundancy?
When we talk about redundancy in uninterruptible power supply systems, we’re not simply referring to backup power but to operational assurance. Redundancy is about keeping your systems online even when a UPS module fails or is taken offline for maintenance. It’s a design principle that enables fault tolerance at the electrical level, and in regulated sectors, it’s often a mandated requirement.
Why Is UPS Redundancy Important?
For healthcare tenders, particularly where theatre lighting, life support or ICU load is involved, minimum uptime thresholds are non-negotiable. In public safety applications like police communications, ambulance dispatch or critical CCTV feeds, a single point of failure could mean reputational damage or worse, compromised response.
This is why redundancy isn’t a budget line item. It’s a compliance measure. In our work at PSS Distributors, we’ve seen tender submissions fail simply because the proposed UPS solution couldn’t demonstrate redundancy alignment with the application’s risk class.
What’s important to remember is that more redundancy isn’t always better. We regularly advise consultants who’ve specified 2N or N+2 topologies where a well-engineered N+1 would have been sufficient, and much more cost-effective. Misaligned redundancy not only adds cost, but it also increases system complexity and servicing overheads.
As a general rule:
Low to medium risk environments (e.g. council depots, IT closets) may not require formal redundancy.
Critical sites (e.g. hospitals, data centres, air traffic control) often demand documented N+1 or 2N protection.
Modular systems can provide redundancy with scalability, reducing upfront investment.
If you’re in the process of defining your site’s UPS redundancy strategy, we assist engineering teams every week with load class analysis and specification validation.
N+1 redundancy is a fault-tolerant UPS architecture that includes the exact number of power modules needed to support your full critical load (N), plus one additional module (+1). If one unit fails or is taken offline, the remaining modules continue supplying uninterrupted power.
How It Works
Required UPS capacity = “N”
One extra module added = “+1”
If any one module fails, system still operates at full capacity
For example, if a site needs 3 modules to handle the load, an N+1 setup will include 4 modules, ensuring continuity without the need for failover switching.
Where to Use N+1 Redundancy
This configuration strikes the right balance between uptime and cost, especially when combined with modular UPS systems. It’s commonly specified in:
Epower UPS (10kVA–200kVA modules)Epower is not modular
PMU-T in Parrallel configuration
PMU+ is modular
These units feature plug-and-play modules, decentralised parallel structure, and common battery architecture, ideal for service continuity without overspending.
Benefits of N+1 Redundancy
Maintains full load during one module failure
Avoids full system duplication
Faster ROI compared to 2N
Ideal for modular growth strategies
Example clause: “UPS system must feature modular N+1 redundancy, with sufficient capacity to sustain full critical load during module failure or maintenance.”
2) What Is 2N Redundancy in UPS Architecture?
2N redundancy refers to two completely independent UPS systems, each fully capable of supporting the entire load. One is active; the other is ready to take over with no interruption if the first fails.
How It Works
One UPS system supports full load
Second UPS mirrors the first with identical capacity
If UPS-A fails, UPS-B seamlessly takes over
There’s no single point of failure: batteries, inverters, or even monitoring systems.
Where to Use 2N Redundancy
The 2N configuration is used in zero-downtime environments where even a single UPS module failure is unacceptable:
Tier III & IV data centres
Defence and military operations
Mission-critical healthcare (ICUs, theatres)
Banking platforms and national payment infrastructure
Example clause: “UPS configuration must support 2N redundancy: two independent, mirrored systems capable of sustaining 100% load in the event of full system failure.”
3) What Is Modular Redundancy in UPS Architecture?
Modular redundancy refers to a UPS design where capacity and redundancy are built using interchangeable moduleshoused within a central chassis. Each module operates independently and contributes to the total system load.
How It Works
UPS capacity built using multiple swappable modules
Redundancy achieved by adding extra modules (e.g. N+1)
Modules communicate via decentralised control
When one module fails, it can be removed and replaced while the rest of the system stays online.
Where to Use Modular Redundancy
Modular UPS systems are ideal when projects demand:
Both models support up to 10 modules per rack, with high power density (520kVA max), plug-and-play servicing, and touch-screen LCD diagnostics.
Benefits of Modular Redundancy
Hot-swappable architecture
Scale from 20kVA to 520kVA
Centralised battery bank
Reduced footprint, simplified maintenance
Faster procurement and installation
Example clause: “UPS system must utilise a modular, hot-swappable design with support for N+1 redundancy and decentralised control.”
When Should You Specify Redundancy in Tenders?
Not every project needs full system redundancy, but the ones that do, really do. The right level of UPS redundancy in your specification depends on your site’s risk profile, regulatory requirements, and downtime tolerance.
Redundancy ensures that even if part of your UPS fails, critical operations continue uninterrupted. But redundancy should be intentional, not automatic. Overspecifying increases capital and operating costs. Underspecifying exposes your site to reputational and operational risk.
How to Decide on Redundancy Level
Site Type
Recommended Redundancy
Typical Runtime Requirement
Hospital ICU / Surgical Suite
N+1 or 2N
15–30 minutes minimum
Small Data Centre / Server Room
N+1 (scalable to 2N if Tier III)
10–20 minutes, depending on load
Council CCTV Node / Roller Shutter
No redundancy (single path UPS)
5–10 minutes
Transport Switching Station
N+1
15–30 minutes
Mining Operations
Modular N+1 recommended
Varies – consider runtime and load
If your project has uninterruptible load requirements like real-time control systems or patient life support, the expectation will be N+1 at a minimum, often 2N. But for auxiliary or peripheral systems, single-path UPS may be sufficient.
Use Redundancy Only Where Justified
Tender reviewers increasingly want to see risk-based design, not templated overengineering. Including N+1 or 2N must be defensible. Consider:
Redundancy is about availability. Runtime is about autonomy. You can have one without the other, but most mission-critical environments require both.
Note: Redundancy ≠ runtime
→ Runtime = how long your load stays up during an outage
→ Redundancy = whether a single fault will take your load offline
Have you considered runtime and redundancy? Download our UPS Tender Cheat Sheet.
Common Tender Mistakes When Specifying Redundancy
In procurement reviews, I’ve seen well-intentioned UPS specs lose marks (or worse, misalign with the site’s true operational needs0 because redundancy was misunderstood or misapplied. Redundancy is a technical safeguard, but it must be strategically specified.
1) Writing “2N Preferred” Without Dual Supply Infrastructure
If your site doesn’t have dual incoming mains feeds, physical separation between A/B systems, or load-transfer architecture, specifying 2N is misleading. Redundancy at this level is only viable when power and distribution infrastructure are designed to support it.
What to specify instead: “UPS configuration must provide N+1 redundancy. 2N configuration acceptable where dual utility or generator feeds exist.”
2) Confusing Modular UPS With Modular Redundancy
Many tenders use “modular” and “redundant” interchangeably. They’re not the same. A modular UPS supports scalability and hot-swappable components. Redundancy comes from configuring extra capacity (e.g. 3 x 10kVA modules for a 20kVA load = N+1).
What to specify instead: “UPS must use modular architecture and provide N+1 redundancy within rack configuration.”
3) Failing to Match Redundancy to Load Type
Not all loads warrant redundancy. Surveillance systems, access control, and non-critical lighting can often tolerate short interruptions. But hospital equipment, financial systems, and core networking do not.
Over-specifying redundancy for every subsystem increases cost without benefit.
What to specify instead: “Critical loads must be supported by UPS with N+1 or greater redundancy. Peripheral systems may use single-path UPS without redundancy.”
4) Ignoring Space and Electrical Provisioning for Growth
Some specs call for scalable redundancy (e.g. “system must be expandable to 40kVA”) but forget to allocate the physical rack space, power, or cooling envelope required for future modules.
What to specify instead: “UPS must allow capacity expansion to 40kVA within existing cabinet. Tendering party must confirm space, heat dissipation, and circuit allowance.”
Want to avoid these and other common spec issues? Download: Top 10 Mistakes in UPS Tender Specs.
UPS Redundancy and Tender Compliance in Australia
When specifying uninterruptible power systems for Australian tenders, aligning with statutory and industry-specific expectations is non-negotiable. Over the years, I’ve worked closely with procurement leads across health, transport, defence, and utilities. And one thing is clear: UPS redundancy isn’t a preference; it’s often a compliance requirement.
Redundancy Requirements in Healthcare Tenders
In hospital and healthcare facility tenders, N+1 redundancy is frequently mandatory. This is especially true for:
Intensive care and surgical suites
Medical imaging rooms
Critical life support systems
Nurse call and communication infrastructure
In addition, most specs stipulate hot-swappable battery modules and no single point of failure across power continuity systems.
Example clause: “UPS shall provide N+1 modular redundancy. Battery modules must be hot-swappable and accessible from the front panel. System must support fault-tolerant operation.”
Government and Infrastructure Compliance
For government-run infrastructure, particularly data centres, rail signalling, or utilities, redundancy clauses often reference international and local standards. Among the most commonly cited:
AS/NZS 62040 series (particularly Part 3)
Uptime Institute Tier compliance for redundancy and fault tolerance
ISO 22301 (Business Continuity) where applicable
Specs frequently seek modular, decentralised UPS configurations to facilitate rapid service and reduced MTTR (Mean Time to Repair).
PSS has supplied fully compliant N+1 and 2N modular UPS systems across multiple state and federal projects, including health precincts, smart city networks, and transport hubs.
Our Tender Documentation Advantage
Apart from providing UPS hardware, we also supply the technical artefacts required for compliance sign-off:
Product datasheets with test ratings (e.g. MTBF, THDi, PF)
Redundancy configuration diagrams
Warranty and support SLAs
Site planning tools and load calculators
This ensures procurement officers and consulting engineers have the right language and documentation to justify the selection.
N+1 redundancy means the UPS system includes one more power module than is required to support the full load. If your load requires 40kVA, the system will include 40kVA of capacity plus one additional module (e.g. 20kVA), ensuring uninterrupted operation even if one module fails. It’s a cost-effective way to build resilience without doubling infrastructure.
Example clause: “UPS must support N+1 redundancy with autonomous modules capable of maintaining full load upon single module failure.”
Is 2N UPS redundancy always required in tenders?
No. 2N is rarely mandatory but often preferred in the most critical environments, such as Tier IV data centres, defence infrastructure, or life-support-intensive hospital zones. 2N systems use two completely independent UPS paths, each capable of supporting the entire load. Most government and commercial tenders favour N+1 unless there’s zero tolerance for risk.
What’s the difference between modular and N+1 redundancy?
N+1 describes the redundancy model: having one more module than needed for the load.
Modular refers to how the system is built: smaller swappable units that slot into a rack, offering scalability, hot-swap maintenance, and decentralised fault handling.
Many modular systems support N+1 or even 2N+1 configurations, but not all N+1 systems are modular.
Final Considerations for UPS Architecture Redundancy
When we review UPS tenders at PSS Distributors, one pattern is clear: redundancy often gets overlooked until something goes wrong. N+1, 2N, and modular UPS configurations are decisions that determine whether essential services stay online during a crisis or stall in the dark.
If your facility handles healthcare, transport, data infrastructure, or public safety, redundancy is not optional. But neither is over-specifying and blowing out the budget. That’s where understanding the nuances of N+1, 2N, and modular design can give you an edge, not just in performance, but in procurement credibility.
Let us help you get the spec right the first time. Our technical team reviews tenders daily and can help you avoid the usual traps: ambiguous uptime targets, unscalable systems, vague phrasing. We are fluent in both engineering and compliance, and we’re here to help.
Resources
Download the UPS Tender Cheat Sheet →
A quick-reference guide to spec writing, sizing, redundancy planning, and technology comparisons.
Submit Your Tender Spec for Review →
Upload your current draft and we’ll give you feedback on runtime sizing, redundancy, topology, and compliance fit.
Download UPS Specification Template →
An editable document you can use to write more accurate, review-ready tender specifications.
Explore Modular and Epower UPS Products →
Browse our N+X modular UPS solutions: scalable, hot-swappable (Modular), and engineered for mission-critical uptime.
To choose the right battery for UPS runtime in tenders, match your runtime requirement to load size, then evaluate battery chemistry. VRLA offers lower upfront cost but shorter life; lithium-ion delivers faster recharge, longer service life, and better performance under high-load or space-limited conditions. Always validate with load estimates and runtime charts.
Introduction
In critical infrastructure tenders, battery selection is a defining parameter that shapes everything from cost modelling to operational risk. Runtime determines battery chemistry, system footprint, recharge cycles, and long-term serviceability.
Whether you’re specifying a system for a regional hospital, remote telemetry station, or emergency response hub, how you define autonomy and battery type in your UPS submission will directly influence your compliance, lifecycle cost, and site resilience.
At PSS Distributors, we see too many tender specs omit this detail only to run into surprises at deployment. This guide is designed to help you get it right from the start.
What is the Importance of Runtime in UPS Tender Specifications?
When we talk about runtime in a UPS context, we’re referring to autonomy, the number of minutes a system can support your load after mains power is lost. And in tender submissions, this isn’t a field to leave vague.
A UPS designed for 5 minutes of backup is an entirely different specification to one built for 30 or 60 minutes. Longer runtimes require more batteries, often larger cabinets, and careful consideration of recharge cycles. Yet we frequently see specs that simply state “UPS with backup battery” without defining the autonomy target, forcing vendors to make assumptions that may misalign with operational requirements or compliance mandates.
What Runtime Should I Specify in a UPS Tender?
At PSS, we help clients match runtime to real-world application scenarios:
5–10 minutes: Enough for orderly server shutdown or short mains interruptions.
15–30 minutes: Required in many public safety, communications, or industrial automation setups.
60+ minutes: Often mandated for pump control, transport signalling, or remote comms sites.
How Does UPS Runtime Affect Battery Type, Cabinet Size and Cost?
Your runtime target has a direct impact on:
Battery Type: Lithium-ion systems often offer more runtime per unit of space than sealed lead-acid (VRLA).
Cabinet Footprint: More batteries mean larger enclosures, which affects installation space and weight-bearing structures.
Cost and Maintenance: Longer runtimes increase capital cost but may reduce risk or generator dependency.
Too often, runtime is an afterthought in tender specs, until the quote arrives and the cabinet grows by 2 metres. This is avoidable.
When specifying a UPS for tender projects, especially in government and commercial applications, runtime is often the first figure questioned, but it’s rarely understood correctly. One of the most common errors I see is taking the UPS’s kVA rating at face value without assessing the actual load drawn by the connected equipment. Runtime targets should be built around real-world conditions, not brochure wattages.
How Do You Estimate Load for UPS Runtime Planning?
To get realistic runtime estimates:
Measure Actual Load: Instead of assuming you’ll run a 3kVA UPS at full load, measure the expected power draw. For instance, if your connected equipment draws 1.8kW, you’ll need a UPS that can support that comfortably, factoring in efficiency losses and start-up surges.
Apply Derating Factors: No UPS runs at 100% efficiency in real-world conditions. Apply a 20–30% buffer to account for battery ageing, environmental factors, and margin for expansion.
What is the Runtime Expectation from VRLA and Lithium-ion UPS Systems?
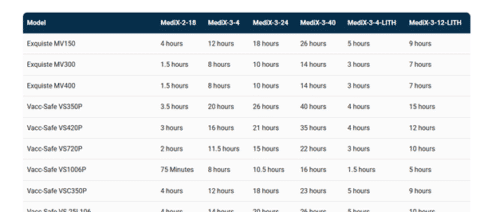
Here are real-world examples from our own systems:
3kVA UPS with VRLA batteries: A 3kVA unit running at 1.8kW with four 9Ah VRLA batteries (e.g., PSS9 or PSS12) may deliver around 10 minutes of runtime. If extended runtimes are needed, larger capacity VRLA batteries (PSS33, PSS55, or PSS100) can be configured.
XL+ Lithium 3000 with EBXL modules: This system offers much better runtime-to-weight ratios. Depending on the number of EBXL packs installed, you can achieve between 18 and 60 minutes of runtime for similar load conditions, all within a rack-mountable form factor.
Tip: Always include a 20–30% runtime margin in your tender specs to ensure uptime even as batteries age or load conditions shift.
Reference: See the runtime charts in our Lithium-ion UPS and VRLA battery product pages to align your runtime requirements with real, tested configurations.
What Are the Advantages of VRLA Batteries in UPS Tender Specs?
Valve-Regulated Lead-Acid (VRLA) batteries are the longstanding industry standard for UPS systems, particularly when budgets are tight and runtime demands are moderate. They’re sealed, low-maintenance, and offer predictable performance for short to mid-range backup applications.
Key Characteristics
Design life: Typically 3–5 years, with long-life options (like PSS9LL) rated up to 10 years
Cycle life: ~200–400 full charge/discharge cycles
Recharge time: 8–12 hours typical
Form factor: Bulky, heavier per Ah; requires vented installation in some environments
Safety: Safe sealed design, but ventilation should be considered for large arrays
Use Cases
Council buildings and emergency lighting
Security panels and access control
Short-runtime applications where uptime risks are minimal
Tender specs where cost efficiency is prioritised over lifecycle performance
Product Examples
PSS9 – 12V 9Ah UPS Battery: Compact SLA battery suitable for small UPS systems and fire panels.
PSS100 – 12V 100Ah UPS Battery: High-capacity VRLA suited for large installations or battery banks.
Example clause: “Preferred battery type: VRLA sealed lead-acid, 10-year design life, 12V modules, with maintenance-free construction.”
What Are the Advantages of Lithium-Ion UPS Batteries in UPS Tender Specs?
Lithium Iron Phosphate (LiFePO₄) batteries promise higher efficiency, deeper cycle performance, and lower total cost of ownership over time. They are increasingly favoured in tenders requiring frequent cycling, long runtimes, or compact installation footprints.
Key Characteristics
Design life: 8–12 years, depending on load and charge profile
Cycle life: 2000–4000+ full cycles
Recharge time: Typically 4–6 hours (with fast recharge support)
Weight and size: Up to 60% lighter than VRLA, with better energy density
Thermal stability: Excellent performance in high-temp or harsh industrial conditions
Use Cases
Hospitals and medical equipment backup
CCTV, industrial automation, and roller shutter systems
Projects requiring extended runtime with compact form factors
Tender specs that require hot-swap and modular expansion
Product Example
XL+ Lithium UPS (1000–3000VA): Compact rack/tower convertible design, LiFePO₄ battery integration, extended runtime with EBXL packs, fast recharge (to 90% in 6–8 hrs), and built-in network surge protection.
Example clause: “UPS system must support lithium-ion batteries with a minimum 10-year design life and hot-swappable configuration.”
How Can You Scale UPS Runtime Using External Battery Packs and Cabinets?
When specifying UPS systems for critical tenders, runtime flexibility can be just as important as topology or battery chemistry. Many procurement teams overestimate the backup needed at full load, only to under-specify installation space or fail to account for recharge intervals. The right runtime strategy is one that’s engineered, not guessed.
When Should You Specify Extended Runtime?
Extended runtime is essential when:
The site has no generator or expects delayed switchover
The UPS supports emergency lighting, safety systems, or industrial load continuity
Recharge times are constrained (e.g. lithium-ion systems with faster cycles)
The tender stipulates minimum runtime at full or partial load
If the UPS is intended to bridge power gaps longer than 10–15 minutes, or support staged shutdowns, external battery banks must be accounted for.
What Are EBXL Packs and When Are They Used?
PSS’s XL+ Lithium UPS range supports EBXL external battery modules: preconfigured, rackmount-compatible packs that extend runtime without complex cabling or installation overhead. They’re useful in:
Industrial and medical sites where runtime needs exceed integrated capacity
Remote facilities where frequent power disruptions are anticipated
Spec scenarios requiring 30+ minutes at 80% load without generator support
Each EBXL unit connects smoothly to the UPS, and recharge times remain within 6–8 hours even with multiple packs, thanks to onboard battery management and high-efficiency charging systems.
What VRLA Battery Cabinet Options Are Available?
For tender specs using sealed lead-acid batteries (e.g. PSS12, PSS100), runtime is typically extended via fused, pre-wired battery cabinets. These include:
Rack-compatible steel enclosures
Proper venting for thermal stability
Internal fusing and breakers for safety
Anderson or screw-terminal connectors for straightforward integration
Each cabinet is dimensioned to accommodate up to 4x 12V 100Ah batteries (or equivalent) to guarantee scalable runtime in predictable increments. Remove this it is incorrect and does not need to be here
Why Isn’t Runtime Gain Linear with More Packs?
Runtime extension isn’t a straight line. Each additional pack contributes less incremental time due to:
Battery inefficiency at low charge states
Voltage sag and load interactions
Environmental factors like ambient heat
That’s why runtime charts, such as those found on our UPS product pages, are essential for realistic runtime modelling.
What Should You Consider During UPS Battery Installation?
Battery cabinets and packs must be integrated into your project’s electrical and mechanical design. Considerations include:
Floor loading: VRLA cabinets can weigh over 150 kg fully loaded.Floor standing battery cabinets can weight over 1T when fully loaded
What Are the Differences Between VRLA and Lithium-Ion Batteries for Tender Projects?
When it comes to specifying battery type in UPS tenders, the decision isn’t just about initial cost but about aligning lifecycle performance, runtime autonomy, physical footprint, and serviceability with the project’s risk profile. Here’s a direct comparison of the two most commonly evaluated options:
Criteria
VRLA
Lithium-Ion
Initial Cost
Lower upfront cost
Higher initial investment
Lifespan (cycles)
200–400 cycles
2000+ cycles
Weight & Size
Heavier and bulkier
Lighter and more compact
Recharge Time
8–12 hours to 90%
4–6 hours to 90%
Maintenance
Periodic inspection needed
Minimal; advanced BMS included
Suitable For
Occasional outages, static environments
High-availability sites, mobile or weight-sensitive installs
VRLA or Lithium-ion Battery?
Choose VRLA if:
Budget is a major constraint.
The UPS is expected to run infrequently or only during prolonged outages.
Physical space and weight are not primary concerns.
Choose Lithium-Ion if:
Your project demands long-term cost efficiency and lower maintenance.
The UPS may cycle frequently (e.g. in remote or solar backup contexts).
Space, heat generation, and weight constraints apply, like in medical carts or tight equipment racks.
At PSS Distributors, we supply both battery types, including long-life sealed lead-acid models such as the PSS9LL (12V 9Ah) and compact, high-efficiency LiFePO4 lithium-ion systems embedded in our XL+ Series UPS. Runtime can be scaled using external battery packs or cabinets to meet autonomy targets.
Both?
PSS Distributors’ Vacc-Safe PowerGuard is a medical fridge that supports both VRLA and lithium-ion batteries. Available in three sizes.
Recommendation Matrix
Runtime > 1 hour, frequent outages → Lithium-ion
Runtime < 30 minutes, infrequent use → VRLA
Access-challenged environments → Lithium-ion (due to low maintenance)
Budget-driven non-critical projects → VRLA
Download our UPS Tender Specification Template for pre-written clauses based on battery type selection.
What Are the Most Common Mistakes When Specifying UPS Batteries in Tenders?
Battery specifications are often the weakest link in UPS tender documents. Over and over, we see otherwise robust specs fall short when it comes to autonomy, compatibility, and lifecycle planning. Below are the most common pitfalls and how to avoid them.
1) Quoting Runtime Without Load Context
Saying “15 minutes runtime” means nothing unless you define at what load. A 3kVA UPS delivering 15 minutes at full load performs very differently from one delivering it at 50%. Tender reviewers need to verify that the runtime is both technically feasible and fit-for-purpose.
Example clause: “UPS must provide 15 minutes runtime at 70% of rated load with battery configuration detailed in the technical annex.”
2) Omitting Battery Autonomy Targets
This factor concerns the system’s ability to stay operational during outage windows relevant to your environment. Hospitals, for instance, may require different levels of autonomy across departments. Skipping autonomy targets exposes you to misquotes, undersizing, or non-compliance.
Example clause: “Minimum battery autonomy of 30 minutes under 80% load required. Runtime must be scalable via external battery modules.”
Specifying battery technology without acknowledging maintenance intervals or replacement timelines is a common blind spot. This can inflate operational costs or compromise uptime in year 3 or 4 of the deployment.
Example clause: “Battery type must support >2000 cycles and include integrated battery management for predictive maintenance.”
4) Forgetting to Allow Space or Power Allocation for External Battery Cabinets
Tender documents often fail to accommodate the physical realities of autonomy planning. If external battery packs are required, your rack or cabinet design, and even HVAC planning must reflect that.
Example Clause: “UPS system must support scalable runtime through external battery cabinets. Tender response must include dimensional drawings of all cabinets.”
By getting these four areas right, you’re making the reviewer’s job easier, reducing back-and-forth, and ultimately strengthening your bid’s credibility. If you’d like help validating your spec, submit it for a free technical review.
UPS Runtime & Battery Type FAQs
How do I calculate the runtime needed for my UPS?
To estimate runtime, you need to know your:
Total load in watts (not just kVA)
Desired backup duration
Battery configuration of the UPS.
Runtime varies based on load percentage. Most UPS units quote performance at 50% or 100% load. Always validate runtime against real-world conditions using a UPS runtime calculator or request a sizing assessment from your supplier.
What’s the difference between lithium-ion and VRLA batteries in UPS systems?
Lithium-ion batteries are lighter, faster to recharge, and support more charge/discharge cycles, typically over 2,000.
VRLA batteries, while lower in upfront cost, require more frequent replacement and generate more heat.
In tenders, lithium-ion is increasingly favoured for lifecycle value and performance in high-demand or space-constrained environments.
What’s the difference between UPS runtime and system uptime?
UPS runtime refers to how long the UPS can support the load during a power outage, typically measured in minutes.
System uptime is the percentage of total operational time without interruption (often expressed as “five nines” or 99.999%).
In tender specs, runtime is a hardware specification; uptime is a performance metric influenced by UPS design, battery selection, redundancy, and service strategy.
Mistaking one for the other can lead to under-specification and evaluation failure. Always define runtime targets clearly in minutes relative to load profile and battery configuration.
Can I extend UPS runtime with additional batteries?
Yes, many UPS systems like PSS’s XL+ and Enduro ranges support external battery cabinets or modular EBXL packs to extend runtime. These extensions you to scale autonomy based on load requirements, budget, or site limitations. Always confirm the UPS model supports runtime expansion and see to it that cabinet space is allocated accordingly.
Final Considerations for UPS Runtime & Battery Type
Battery selection is a decision that directly impacts system reliability, tender compliance, and long-term cost of ownership. Whether you’re specifying runtimes for critical hospital loads or planning for modular runtime flexibility in council ICT rollouts, getting the battery chemistry and capacity right is critical.
At PSS Distributors, we help project consultants, electrical engineers, and procurement leads model runtimes, select matching battery cabinets, and write clauses that won’t raise eyebrows at evaluation.
Resources
Download the UPS Tender Cheat Sheet →
Covers runtime vs battery spec guidance, common mistakes and example wording.
When preparing a UPS tender, prioritise systems with high online efficiency (≥94%), support for Eco mode (up to 98%), and a power factor of 0.9 or above. These metrics directly impact energy performance, cost efficiency and compliance with commercial and government benchmarks. Not all models meet these criteria. Check carefully before submitting.
Introduction
When reviewing UPS tenders, energy efficiency is often treated as a secondary concern, when in fact, it’s becoming a standardised requirement across government, healthcare, and infrastructure submissions. Whether the objective is lifecycle cost reduction, meeting sustainability KPIs, or qualifying for funding, the efficiency metrics of your UPS system can directly influence bid compliance.
In this PSS Distributors guide, I’ll walk through the three metrics we’re most frequently asked about: online efficiency, Eco mode, and power factor, so you can evaluate whether your documentation meets technical and operational expectations.
What Does UPS Efficiency Mean in a Tender Context?
When we talk about UPS efficiency in tenders, we’re referring to how well the system converts incoming power into usable energy without wasting it as heat. A more efficient UPS means:
Less power draw from the grid
Lower electricity bills
Reduced strain on cooling systems
It’s an operational and environmental win.
Australian government and healthcare tenders are increasingly including specific efficiency thresholds in their documentation. You’ll often see clauses like “UPS must deliver a minimum of 95% efficiency in online double conversion mode” or requirements for Eco mode support to meet energy-saving mandates during non-peak load conditions.
If you’re unsure whether your documentation meets the mark, our team can review it for compliance and practicality.
Online efficiency refers to how effectively a UPS converts utility power to a clean, uninterrupted output under double-conversion operation. In other words, it’s the percentage of incoming energy that gets delivered to the load without being lost as heat during continuous AC-DC-AC conversion.
For tender-grade systems, online efficiency typically sits between 90% and 96%. The closer you are to the higher end, the less waste heat your system generates, and that directly reduces cooling loads, electricity bills, and total cost of ownership.
What UPS Models Have High Online Efficiency?
Take PSS’s Modular UPS Series, for example. With up to 95.5% online efficiency, it’s well-suited to large-scale infrastructure projects that can’t afford thermal inefficiencies. The Element Series performs strongly too, offering ≥94% in normal double-conversion mode. These figures demonstrate compliance with energy efficiency benchmarks often included in government and healthcare procurement.
High online efficiency isn’t just a “green” feature. It often determines whether the UPS can be deployed in environments with strict energy performance ratings. Lower-efficiency units (like the GP or Master Series) might still deliver clean power but may fall short of today’s sustainability and lifecycle cost requirements.
If you’re reviewing a UPS tender draft and unsure whether your efficiency numbers stack up, we’re happy to review your spec and identify any weak points.
Eco Mode, also known as economy mode, is an operating condition where the UPS routes incoming power directly to the load via a bypass line, only engaging the inverter when voltage drops outside a safe range. The key advantage here is higher efficiency, often exceeding 97%, because the system avoids constant double-conversion. Acts as a Line-Interactive UPS
However, the gain in energy efficiency comes with a trade-off: a short delay during switchover. While this is usually just a few milliseconds, it can be enough to impact sensitive medical, industrial, or communications equipment that can’t tolerate even brief voltage deviations.
When is Eco Mode Safe to Use?
So, when does Eco Mode make sense? If you’re supporting non-critical loads in a site with stable grid conditions, such as a:
Commercial office
Retail outlet
Secondary data backup room
…it can be a smart way to lower energy costs over time.
But for
Hospital theatres
Mining control rooms
Rail signalling infrastructure
…Eco Mode is generally avoided in favour of continuous double-conversion protection.
What Are the Best UPS Models with Eco Mode?
Among PSS’s tender-grade systems, the Element Series and Enduro Long Series both support Eco Mode and achieve efficiencies up to 98% when it’s active. CamSecure also includes this feature, with a clear jump in efficiency between standard operation (89%) and Eco Mode (97%). Similarly, the PMU-T Series delivers 98%+ in Eco Mode, making it a viable choice where maximum efficiency is desired without compromising uptime integrity.
When Are Eco Mode UPS Models Not Recommended?
Where you should be cautious is when you’re drafting tenders for mission-critical environments. If the brief includes zero transfer time or mandates uninterrupted double-conversion, Eco Mode should be excluded from both operational design and procurement criteria.
Power factor measures how effectively a UPS converts incoming electrical power into usable output. In simple terms, it’s the ratio of real power (watts) to apparent power (VA). A power factor of 1.0 means every watt drawn from the wall is delivered to the equipment. A lower power factor, say 0.8, means 20% of that capacity is effectively wasted or lost to inefficiencies.
Why Should You Care About UPS Power Factor?
This number directly impacts how your tender is sized. If you’re backing a 10kVA load and the UPS has a 0.8 power factor, you’ll only get 8kW of usable power. That shortfall can mean undersized protection or runtime gaps, particularly if your spec doesn’t account for the difference between VA and W.
What UPS Models Have Good Power Factors?
Most new-generation UPS systems support a power factor of 0.9 or higher. The Element Series delivers unity (1.0), which is ideal, while the PMU-T and Enduro Long Series offer 0.9, more than sufficient for most commercial and industrial tenders. At the other end, entry-level systems like the Eco Series sit at 0.6, which isn’t suitable for critical infrastructure or any regulated procurement.
Example clause: “UPS must support an output power factor of 0.9 or higher to ensure accurate load capacity and runtime alignment.”
If you’re working with real-world load profiles and tight runtime requirements, make sure the power factor is front and centre in your evaluation criteria. It’s one of the most overlooked variables and one of the easiest to get wrong.
Which PSS UPS Models Meet Tender-Grade Efficiency Standards?
If you’re preparing specs for commercial, industrial, or government infrastructure, this side-by-side table makes evaluation simple. It compares every UPS in our current lineup across the three metrics tender assessors focus on: Eco Mode availability, true online efficiency, and power factor output.
Model
Eco Mode
Online Efficiency
Power Factor
Element Series (PSS-EL-6-22/33/55)
Yes – up to 98%
≥94%
Input ≥0.99 / Output 1.0
PMU-T Series
Yes – >98%
>94%
0.9
Enduro Long Series
Yes – up to 97%
≥89%
0.9
CamSecure UPS
Yes – up to 97%
89%
≥0.98
Patriot Modular DC UPS
Not listed
≥93.2%
Not listed
Industrial DC UPS
Not listed
93%
Not listed
XL+ Standard
Not listed
98% (mains)
0.8
XL+ Lithium
Not listed
98% (mains)
0.8
RollUPS (Select 3-Phase)
Yes – “Energy saving mode”
Not listed
Not listed
Modular UPS System
Not listed
Up to 95.5%
0.9
GP Series
Not listed
>85%
0.8
Epower Series
Not listed
89–96% (model-dependent)
≥0.98 (10–400kVA) / ≥0.85 (500–800kVA)
Master Series 3:1 Phase
Not listed
>85%
0.8
Medi-X Series
Not listed
98% (mains, line-interactive)
Implied 0.8 (not stated)
Eco Series (800–2200VA)
Not listed
Not listed
0.6
Use this table to quickly shortlist units matching your compliance and sustainability requirements.
Do Australian Tenders Mandate UPS Efficiency Minimums?
Not every government or commercial tender sets a hard threshold for UPS energy efficiency, but in sectors where power draw, thermal load, or sustainability targets matter, it’s increasingly common.
From our work with infrastructure consultants and procurement leads, here’s what we’re seeing:
Healthcare and hospitals are favouring UPS systems with ≥94% online efficiency to help meet NABERS targets and reduce HVAC load in equipment rooms.
Data centres and ICT facilities often lean on internal green standards, where UPS systems with Eco Mode (up to 97–98%) can support lower PUE outcomes.
Mining and remote operations require efficiency to manage generator load, fuel usage, and thermal dissipation – making higher power factor units (≥0.9 or 1.0) more attractive.
Local councils and public facilities tend to prioritise lifecycle efficiency in RFTs, especially when specifying battery runtimes over 15 minutes.
Tips for Framing UPS Efficiency in Your Tender
Instead of locking your tender into one model, frame the performance expectations around outcomes:
“UPS system must deliver minimum 94% efficiency in online (double conversion) mode under typical load conditions.”
“Solutions offering Eco Mode or energy-saving operation above 97% efficiency will be considered favourably.”
“UPS must support output power factor ≥0.9 to optimise usable capacity.”
This approach keeps the door open to multiple brands while still aligning with best-practice performance thresholds.
What is the ideal online efficiency for a government UPS tender?
For most public sector projects, a UPS with at least 94% online efficiency (in double-conversion mode) is recommended as such a unit would help reduce energy losses and cooling demands, especially in hospitals, schools, and data hubs where systems run 24/7. Some sites may also give preference to systems supporting Eco Mode above 97% during steady-state operation.
Is Eco Mode safe for critical infrastructure projects?
Eco Mode can safely reduce power losses during low-load or stable grid conditions, but it’s not appropriate for every environment. For example, hospitals and critical control centres often exclude Eco Mode unless it’s proven to switch seamlessly with no impact on load. Always assess the risk profile and ask for test results or case studies before inclusion.
How does UPS power factor affect sizing and runtime?
Power factor affects how much real power (in kW) a UPS can deliver relative to its rated size (in kVA). A system with a 1.0 power factor delivers full capacity as usable power, ideal for tight sizing. Lower values, like 0.8, reduce runtime and usable output, which can lead to oversizing or unexpected shortfalls during an outage. Aim for ≥0.9 where possible for better performance-to-footprint ratio.
Final Considerations for UPS Efficiency Standards
Selecting a UPS for a tender submission isn’t only about capacity and runtime. Efficiency standards, particularly around Eco Mode, power factor, and online conversion, are increasingly used as indicators of system quality, energy compliance, and long-term operational cost. Whether you’re drafting for a government infrastructure upgrade or a commercial build, making the wrong call on these criteria could limit your eligibility or inflate whole-of-life costs.
With standards tightening across public and private sectors, it’s worth taking a moment to validate your efficiency metrics against what’s expected in modern tenders. PSS Distributors works with procurement officers and consultants daily to align UPS specifications with real-world site loads and compliance needs.
Resources
Download the UPS Tender Cheat Sheet →
A fast-reference guide outlining the most common efficiency-related mistakes in UPS specifications. Created to support clear, standards-ready documentation.
Submit Your Tender Spec for Review →
Upload your working draft, and our engineering team will provide practical feedback on alignment with performance, reliability and compliance criteria.
Download UPS Specification Template (Word Format) →
Customisable clauses covering runtime, diagnostics, energy benchmarks and redundancy expectations. Ideal for government and commercial tender packs.
For government and commercial projects, online/double conversion UPS systems offer the highest protection for critical loads. Line-interactive models suit moderate-risk environments with occasional disturbances, while offline UPS is best reserved for non-critical, short-runtime applications. Matching topology to risk, runtime, and load type is essential for a compliant, fit-for-purpose tender submission.
Introduction
UPS topologies aren’t interchangeable, yet they’re often treated that way in tenders. We frequently see “double conversion” specified where a line-interactive system would have sufficed, or worse, no topology requirement listed at all. This creates ambiguity for bidders, introduces cost variability, and risks under-specification.
At PSS Distributors, we review dozens of public and private sector UPS specifications every quarter. This article outlines the key UPS architectures (standby, line-interactive, and online/double conversion) and clarifies when each is appropriate, based on site conditions, criticality, and expected runtime.
What Is a UPS Topology?
UPS topology refers to the architecture of how a UPS conditions and delivers power, in other words, the conversion method between mains power and battery backup.
There are three principal types you’ll encounter in tenders:
Online double conversion topology
Line-interactive topology
Offline (standby) topology
Each has its own implications for cost, availability, protection level, and system complexity.
Why Does UPS Topology Matter in Tenders?
From a procurement standpoint, the topology you specify defines how your power protection system behaves in real-world events: brownouts, voltage spikes, or total outages.
A hospital’s ICU or a rail control system cannot tolerate the same transfer delays or voltage fluctuations that a non-critical admin switchboard might. If your specification leaves the topology vague, it opens the door for bidders to propose systems that may technically comply but fall short of operational needs.
Here’s where tender writers often get caught out: assuming “UPS” is a universal term. It’s not. An incorrectly specified topology may lead to:
Underprotection, exposing your infrastructure to risks during switchover or power conditioning lapses.
Overengineering, where an expensive online system is installed where a line-interactive UPS would suffice, driving up both capex and ongoing maintenance.
Spec challenges or variation claims, particularly in public tenders, where vague technical language invites interpretation.
Our technical team frequently reviews tender documents where topology is either missing entirely or mismatched to the environment. This is easily avoidable with clearer language and a basic understanding of topology strengths and limitations.
When tender specifications demand absolute reliability (no flicker, no lag, no compromise), online or double-conversion UPS systems are the gold standard. This topology is the backbone of our Enduro Series, engineered specifically for critical infrastructure where zero transfer time isn’t negotiable.
How Online / Double Conversion Works
Online UPS systems work by converting incoming AC power to DC, then back to AC. This dual-stage conversion isolates the output power from all input anomalies (voltage drops, spikes, noise, or frequency variations) to deliver a clean, regulated sine wave to your equipment 100% of the time. In other words, the load never “sees” the raw mains supply.
This is markedly different from line-interactive or offline systems, which only intervene when a deviation is detected. In applications where even milliseconds matter (think MRI machines, transport signalling servers, or Tier 3 data centres) those milliseconds can mean data loss, downtime, or worse.
Where Is Online UPS Most Appropriate?
Online UPS systems are ideal for:
Hospitals (ICUs, imaging departments)
Data centres (colocation, hyperscale)
Mining operations
Control rooms for critical infrastructure (rail, defence, energy)
Laboratories and test environments with sensitive instrumentation
At PSS, our Enduro 1–3kVAand 6–10kVAsystems are deployed in these very contexts. These units deliver up to 98% efficiency in ECO mode, zero transfer time, and runtime scalability through hot-swappable external battery modules (EBMs), allowing up to 17+ hours of backup depending on configuration.
Key Benefits of Online / Double Conversion UPS
Zero Transfer Time: Always online, no interruption during switchover.
Power Conditioning: Filters out harmonics, noise, and voltage fluctuations.
Runtime Scalability: Add up to 4 EBMs for extended autonomy (up to 17 hours with 3kVA).
Power Factor = 1 (6–10kVA): Maximises real-world capacity.
Pure Sine Wave Output: Consistent, clean power for sensitive loads.
ECO Mode: Up to 98% energy efficiency without compromising protection.
Multiple Form Factors: Rack/tower convertible, with SNMP relay card options.
Monitoring Ready: Includes USB, RS-232, and optional SNMP card. Alerts via email/SMS.
Tender Specification Tips
Example clause: “UPS system must utilise double-conversion online topology to ensure zero transfer time and continuous power conditioning. System must support extended runtimes via modular external battery packs.”
By explicitly calling for online/double conversion architecture, you not only raise the operational integrity of your project; you also make it clear to bidders that compliance with critical standards is non-negotiable.
2) Line-Interactive UPS Topology
For many commercial and light industrial projects, line-interactive UPS systems offer the sweet spot between protection, performance, and budget efficiency.
At PSS Distributors, our XL+ Series Line-Interactive UPS is engineered with industrial-grade transformer design, high efficiency (up to 98% on mains), and support for extended runtimes through external battery modules. These units are often specified in tender submissions for commercial offices, light IT infrastructure, and environments where power irregularities are infrequent but still present a risk.
How Line-Interactive Topology Works
Line-interactive UPS units provide automatic voltage regulation (AVR). This means they can correct minor power fluctuations such as sags and surges without switching to battery. A built-in autotransformer boosts or lowers voltage as needed, keeping the load stable.
When a true power outage occurs, the UPS switches to battery power within 2–6 milliseconds, fast enough for most commercial equipment to remain uninterrupted. Compared to offline systems, the AVR circuitry makes this topology much more resilient to brownouts and undervoltage events.
Where Is Line-Interactive UPS Most Appropriate?
This topology is ideal when:
Power disturbances are infrequent or short in duration.
The load is non-critical but would benefit from voltage conditioning.
Budget constraints mean online UPS is not justifiable, but reliability remains a concern.
Equipment will not recognise a 6 Millisecond transfer time
In a tender scenario, line-interactive UPS units often support:
Building management systems
Access control panels
CCTV arrays
Roller shutters
Smaller IT racks in government offices/council depots
Medical Fridges/Freezers
The tender reviewer isn’t necessarily looking for the highest possible redundancy here, but they will want to see justification for the choice.
Key Benefits of Line-Interactive UPS
Pure sinewave output: Compatible with sensitive and inductive loads.
High reliability transformer-based design: Minimises service needs and improves robustness.
Scalable runtime: Use EBXL+ external battery packs to increase autonomy based on load.
Lithium-ion or SLA options: Choose based on lifecycle cost or runtime requirements.
Communications: Built-in USB and optional SNMP or relay card for event-triggered actions and remote monitoring.
Rack and tower mountable: Fits a wide range of electrical and ICT installations.
Output socket diversity: Includes Australian 10A and IEC output formats for flexibility.
Tender Specification Tips
Example clause: “Unit must deliver voltage regulation between 177–300V before battery cut-in, and support external battery packs for extended runtime.”
If you need help writing technical clauses to meet NPV requirements, contact our technical team. We’re happy to advise.
3) Offline UPS Topology
We do not have offline UPS – Remove our Eco’s from this but we still need to describe offline. I think it is positive to state we do not have offline
Offline or standby UPS systems are best suited for specific, low-risk use cases where cost efficiency is paramount and power disruptions are rare. They’re not designed for high-availability scenarios, but for distributed low-load sites like NBN nodes, ticketing systems, and non-critical ICT, they’re often the most pragmatic choice.
PSS Distributors’ Eco Series UPS range (600VA–2200VA) includes compact, plug-and-play offline models that provide basic battery backup and AVR. They’re widely deployed across council, retail and low-spec utility applications, where runtime and reliability needs are modest.
How Offline Topology Works
Offline UPS units deliver power directly from the mains during normal conditions. When a power outage or severe voltage irregularity occurs, the unit transfers to battery power, typically within 2–6 milliseconds. For connected equipment that can tolerate minor delays, this transfer is acceptable.
All Eco Series units include automatic voltage regulation (AVR) to help stabilise incoming mains voltage, albeit with limited granularity. Output is typically modified sinewave, which suits most entry-level computing and network gear but may not be ideal for inductive or motor-driven loads.
Where Is Offline UPS Most Appropriate?
This topology is ideal when:
The protected equipment is non-critical and can tolerate brief power gaps.
Power quality is generally stable, with outages being rare.
The tender involves budget-limited distributed installs, such as Wi-Fi routers, IP cameras, or EFTPOS systems.
Runtime requirements are minimal, and space constraints rule out bulkier solutions.
In a government or commercial tender, offline systems are typically specified for:
Point-of-sale (POS) terminals
Local network hardware (e.g. routers, NBN modems)
Entry-level building intercoms or signage
Ticketing kiosks and vending machines
Security DVR/NVR systems
The justification is key: if the load is non-mission-critical and doesn’t require redundancy or pure sinewave output, offline UPS can meet spec, but only if correctly scoped and documented.
Key Benefits of Offline UPS
Cost-effective protection: Ideal for tenders that require coverage of multiple low-load endpoints.
Compact form factor: Models like the Eco800L are wall-mountable and space-saving.
AVR voltage correction: Provides line conditioning even before switching to battery.
Socket diversity: Australian 10A and surge-only outlets support flexible deployment.
Basic runtime coverage: Up to 60 minutes at 100W load (Eco800L), suitable for brief outages.
RJ45 surge protection: Protects network lines from surges and spikes.
USB monitoring: Includes USB connectivity for local monitoring and safe shutdown.
Tender Specification Tip
Example clause: “UPS must deliver pure sine wave output with ≤2ms transfer time and AVR. Suitable for low-risk ICT environments only.”
If your specification includes phrases like “zero transfer time,” “pure sine wave output,” or “modular battery expansion,” offline UPS models will not meet compliance.
How to Select the Right UPS Topology for Your Tender Project
More than being a checkbox exercise, specifying the correct UPS topology is a key determinant of operational continuity, serviceability, and long-term value for the asset owner. If you’re involved in drafting tender documents for government, infrastructure, or commercial bids, a misaligned UPS choice could lead to overcapitalisation, under-protection, or both.
At PSS Distributors, we work closely with consultants, facilities managers and procurement officers to guide topology selection based on real-world operating environments. Here’s what to consider:
1) Site Criticality and Load Type
Mission-critical systems (ICUs, data centres, control rooms) demand uninterrupted, high-quality power, which means online/double conversion is your benchmark.
Moderately critical loads (access control, BMS panels, commercial servers) typically warrant line-interactive units with AVR and pure sinewave output.
Low-priority endpoints (ticketing kiosks, routers, basic signage) are often best served by offline UPS units that can ride through short outages.
2) Runtime Requirements and Autonomy Planning
Map out your required hold-up time during an outage. Will it need to last seconds, minutes, or more?
Double conversion and line-interactive units from PSS support extended runtime through external battery packs, especially relevant where generator spin-up time or remote servicing delays are a factor.
3) Power Environment and Grid Stability
In metro locations with reliable supply, line-interactive topology may be entirely sufficient.
In regional, mining, or edge deployments where mains fluctuations are frequent, the voltage conditioning and surge protection offered by online UPS becomes essential.
4) Budget and Lifecycle Cost Considerations
Initial capex is only part of the equation. Factor in:
Battery replacement intervals (SLA vs lithium)
Efficiency under typical load (wasted energy costs)
Downtime impact if the unit fails or can’t be serviced quickly
Offline UPS units may win on upfront cost but may fall short in total cost of ownership if misapplied to sensitive environments.
Topology Selection Comparison Table
Criteria
Online (Double Conversion)
Line-Interactive
Offline
Power Quality
✅✅✅
✅✅
✅
Cost
$$$
$$
$
Transfer Time
0 ms
~2–4 ms
~6–10 ms
Best For
Hospitals, data centres, defence
Offices, SME, light ICT
Non-critical, distributed endpoints
Every project has different risk thresholds and performance expectations. If you’re unsure which direction your spec should take, our team is happy to walk you through real-world scenarios and model runtimes using your exact load requirements.
Download our UPS Tender Specification Template, a free, editable Word document designed for consultants and facility planners writing UPS tender clauses.
UPS Topology and Australian Tender Compliance
For many government departments, health authorities, and infrastructure contractors, UPS topology isn’t a suggestion but a line-item requirement.
In our experience at PSS Distributors, most federal and state-level tenders, particularly those relating to public health, defence, transport, and utilities, mandate online (double conversion)UPS systems as the minimum standard for critical loads. This is especially true for ICU wards, server rooms handling public data, communications nodes, and traffic signal control cabinets.
The reason is straightforward: compliance with ISO/IEC 62040-3 performance classification, no-break transfer, and consistently clean output regardless of input variation. These expectations reflect both operational risk and governance standards.
However, not all loads require this level of protection. We frequently assist contractors and consulting engineers in justifying a mixed-topology approach when budget efficiency is needed:
Allocating online UPS to essential loads
Line-interactive to conditioned ICT rooms
Offline units to signage, general-purpose computing, or endpoint devices.
Importantly, we’ve supported dozens of successful submissions by providing detailed technical conformity letters, model runtime tables, and lifecycle cost summaries. These allow specifiers to satisfy probity and compliance requirements while tailoring solutions to actual risk.
If your tender includes a clause like:
“UPS system must provide continuous power without transfer interruption under all operating conditions…”
…you’re almost certainly expected to specify an online UPS with no-break operation. If the clause is ambiguous or open to interpretation, we can help unpack the implied compliance obligations and recommend matching solutions from our GP and Enduro online ranges.
Need to cross-reference your draft with current compliance norms? Submit your UPS spec for review and our engineering team will return with marked-up guidance within 48 hours.
UPS Topology FAQs
What is the difference between online and line-interactive UPS?
Online (double conversion) UPS systems provide uninterrupted power by constantly converting incoming AC to DC and then back to AC. This ensures clean, stable output regardless of input fluctuations.
Line-interactive UPS units, by contrast, regulate voltage using an autotransformer and only switch to battery when the power drops or surges beyond a set threshold. The transfer time is typically 2–6ms, which is sufficient for most non-critical loads but not compliant for zero-break applications.
Why is double conversion UPS better for sensitive loads?
Double conversion technology isolates the load from all input anomalies:
Voltage sags
Surges
Frequency variations
Harmonics
That’s why it’s the gold standard for protecting hospital medical equipment, SCADA systems, and critical IT infrastructure.
These UPS systems offer zero transfer time, pure sinewave output, and the ability to run on generator input without brownout risk. For tenders with references to “no-break,” “true online,” or “continuous output conditioning,” this is the topology to specify.
Can I specify line-interactive UPS in government tenders?
Yes, you can specify line-interactive UPS in government tenders if the application and specification justify it.
Line-interactive systems like our XL+ Series are suitable for secondary loads such as building management controllers, CCTV, or secure access systems where occasional voltage correction is needed but full online protection is not mandated.
However, be cautious: if the tender documentation mentions mission-critical infrastructure or refers to IEC 62040-3 Class 1 performance, an online UPS is almost always expected. If you’re unsure, we’re happy to assist with specification alignment and clause interpretation.
Final Considerations for Tender-Ready UPS Topology Selection
Choosing the right UPS topology is a technical decision with real operational consequences. Whether you’re specifying for a new-build hospital, transport node, civic facility, or critical comms hub, each topology comes with trade-offs in cost, performance, and compliance.
At PSS Distributors, we don’t just supply UPS systems but help tendering authorities, engineers and project managers make informed, defensible choices. With decades of industry experience and a product range built for Australian conditions, we support you at every stage: from runtime modelling and load calculation to clause formulation and product documentation.
If you’re preparing or reviewing a UPS specification as part of a government or commercial tender, take advantage of the resources below. They’re designed to save you time, eliminate ambiguity, and ensure technical alignment from day one.
Resources
Download the UPS Tender Cheat Sheet →
Fast-reference guide to redundancy, battery selection, recharge times, and topology specs.
Submit Your Tender Spec for Review →
Upload your draft, and our technical team will advise if it meets performance, compliance and operational benchmarks.
Download UPS Specification Template (Word Format) →
Pre-filled with editable clauses for runtime, battery, diagnostics, and redundancy. Built for procurement officers and consultants.
Recharge time directly impacts UPS uptime planning by defining how quickly a system can return to full backup capacity after discharge. While most systems recharge to 80% in 5–8 hours, only a few offer insights into cycle life or long-term battery health. Procurement teams should prioritise models with clear diagnostics and reliable recharge benchmarks.
Introduction
Most UPS tenders focus heavily on runtime: how long a system can stay online during an outage. But what happens after the first blackout?
If the batteries haven’t had time to recover before the next event, your system could be offline when it’s needed most. That’s why recharge time isn’t just a technical detail but a reliability issue. And yet, many specs gloss over it entirely.
In this PSS Distributors guide, I’ll walk you through how recharge cycles and battery health influence real-world uptime. Whether you’re drafting a tender for a hospital, industrial site, or data centre, understanding battery recovery profiles and diagnostics will help you avoid gaps in protection and futureproof your spec.
We’ll also draw on actual product data so you can see the range of recovery capabilities across modern UPS systems.
What is UPS recharge time?
Recharge time refers to how long a UPS takes to restore its batteries to a usable state after they’ve been fully or partially discharged. For most sealed lead-acid systems, this is typically 5 to 8 hours to reach 90% capacity, but that window can vary depending on:
Battery type
Charger design
Ambient conditions.
Why is UPS Recharge Time Important?
UPS recharge time matters for the reasons below:
System Availability: If your site experiences another power event before batteries have recovered, runtime will be reduced (or zero). For applications like medical fridges, rail infrastructure, or surveillance, that gap in readiness can’t be ignored.
Tender Relevance: Many tender documents focus heavily on runtime but omit recharge time. That’s a risk. A UPS that delivers 30 minutes of backup but takes 8 hours to recover may not be suitable for facilities with multiple daily outages or load cycles. Also various battery types are suitable here
Partial vs Full Recharge: In most industrial UPS systems, 70–80% recharge is considered sufficient to restore short-term protection. Full recharge (100%) can take longer and is more relevant for batteries used at deep discharge depths.
Examples from our deployable products:
The Element UPS series recharges to 80% in 5 hours, making it ideal for overnight recovery in commercial sites.
Higher-end modular models (e.g. PMU-T series) offer user-settable charge rates, allowing alignment with site-specific energy or time constraints.
In UPS specification templates, this value should be clearly defined. A clause like:
“The UPS must support battery recharge to at least 80% capacity within 6 hours under standard load conditions.”
…can help ensure procurement aligns with actual site availability needs.
What is the Role of Recharge Cycles in Tender-Based Planning?
One of the most overlooked aspects in UPS specification is how quickly the system recovers after an outage. While runtime gets the spotlight, recharge time can quietly erode your uptime assumptions, especially in high-risk or multi-outage environments.
What is the Difference between Runtime and Recharge Time?
In simple terms:
Runtime = how long the UPS can support the load during a blackout.
Recharge cycle = how long the batteries take to recover to usable capacity after discharge.
For tender scenarios, especially in critical infrastructure or regional sites where power may be unstable, recharge time directly impacts availability. A unit that takes 8 hours to recharge may leave the site exposed during successive brownouts or faults.
What Are the Risks of Prolonged UPS Recharge Times?
Limited redundancy: Without a second UPS or EBM module, prolonged recharge leaves the system vulnerable.
Battery degradation: Deep discharges followed by insufficient recharge intervals shorten battery lifespan.
Project non-compliance: Some government and health specs require rapid recovery windows for continuity of operations.
What Are the Recharge Times for PSS UPS Models?
While cycle count data isn’t widely disclosed across most datasheets, recharge time benchmarks can still guide planning:
Element Series (PSS-EL-6-22, 6-33, 6-55): SLA batteries recharge to 80% in ~5 hours. Includes smart software for monitoring and alerting.
Enduro Series: Recharge to 80% in approximately 5 hours. Offers optional long-life batteries with 10-year design life.
XL+ Series (SLA and Lithium models): Recharge to 90% in 6–8 hours. Monitoring via LCD panels and UPS Smart Software included.
CamSecure Series: Uses 3-stage charging to reach 80% in 5 hours. SNMP and relay options support external monitoring.
These figures help set expectations for recovery windows. Where recharge time isn’t disclosed, it’s worth clarifying during procurement to avoid risk gaps in your uptime model.
How Can You Tell If a UPS Has Robust Battery Health Monitoring?
Battery health is about lifespan and predictability. Without reliable diagnostics or alerting, battery issues often show up as unplanned downtime, failed compliance audits, or expensive emergency callouts.
Here’s what technical teams and facility managers should be looking for when evaluating battery health readiness:
What Monitoring Features Should a UPS Include?
At a minimum, tender-ready systems should offer:
Status visibilityvia LCD or LED indicators: Battery charge, voltage, temperature, and fault states.
Self-test capabilities: Detect early-stage cell degradation or failed battery strings.
External communication: For alerts and reporting: USB, RS232, RS485, Modbus, or SNMP.
Environmental sensors(where supported): Temperature compensation improves battery longevity under varying ambient conditions.
Logging and notification software: Enables SMS/email alerts for battery condition and power failures.
Which UPS Models Offer Health Monitoring?
Here’s how different UPS models in the PSS Distributors catalogue handle diagnostics and alerts:
Element UPS Series (PSS-EL-6-22, 6-33, 6-55): Features UPS Smart software with USB connectivity. Supports load/battery monitoring, logging, and proactive alerts. 8-year design life (SLA).
Patriot Modular DC UPS: Touchscreen interface with onboard battery self-test. Includes LVBD, temperature compensation, and full diagnostics via RS485/Modbus.
XL+ UPS Series (Standard & Lithium): Includes USB monitoring, SMS/email alerts, and real-time data via LCD/LED indicators. Suitable for SME and light commercial applications.
Enduro UPS Series (1–10kVA): Software-driven battery monitoring with optional 10-year battery upgrades. Event logging, RS232/USB connectivity, and visual health indicators are built in.
PMU-T Modular UPS: Offers LED alerts and optional SNMP for remote diagnostics. LCD shows battery percentage, ambient temperature monitoring, and startup diagnostics.
RollUPS Range: Basic LED/LCD displays for faults, battery status, and runtime warnings. Some models support “Power Manager” USB comms, but without predictive analytics.
GP UPS Series: LCD with detailed battery and voltage readouts. Optional SNMP card available. Offers long-life battery upgrades (10 years).
Want battery diagnostics mapped to your compliance spec? Get in touch.
What Does Good UPS Battery Recharge Look Like on a Spec Sheet?
When reviewing UPS tender submissions, engineers and procurement leads should be able to quickly identify two battery-related metrics:
Time to recover to 70–80% capacity after discharge
Presence of battery health monitoring (diagnostics, alerts, smart software)
Battery design life or lifecycle expectation
UPS recharge time comparison table
Below is a comparison table summarising real values across selected UPS models from PSS Distributors’ range:
Model
Recharge Time
Monitoring Features
Battery Design Life
Element UPS
5 hrs to 80%
USB + software, SMS/email alerts, voltage/status data
8 years
Patriot Modular DC UPS
Not documented
Touchscreen, Modbus TCP/IP, temperature compensation, self-test
How to Reference Recharge and Battery Health in Tender Specs?
Battery performance isn’t just about runtime. In environments where outages are prolonged or sequential (e.g. during storms or rolling blackouts), recharge rate becomes mission-critical. Yet many tender documents miss this entirely.
Here’s how to ensure your specification reflects operational reality:
Set a recharge benchmark: Look for models with proven recharge times, typically 5 to 8 hours to restore 70–80% This provides a clear planning window for successive outages.
Demand onboard health diagnostics: Insist on UPS systems with built-in battery status alerts, logging, and life monitoring. These reduce the risk of silent battery degradation and missed replacement cycles.
Align to service intervals: If your facility uses SLA batteries with an 8–10-year design life, state that upfront. This encourages suppliers to quote appropriately rated systems, not lower-cost substitutes with short-cycle batteries.
Example clause: “UPS system must support ≤6-hour recharge to 90% capacity after full discharge, and include onboard diagnostics for battery condition, alerts, and fault detection.”
UPS Recharge Time FAQs
What is UPS recharge time and why is it important?
Recharge time refers to how long it takes for a UPS battery to recover to a usable capacity, usually measured as time to reach 70% or 80% after a full discharge. This figure is critical in environments prone to multiple outages or short recovery windows. If recharge is too slow, subsequent interruptions may hit with depleted backup, exposing your load to failure.
How do I know if a UPS supports battery health monitoring?
Look for features like battery self-test, temperature compensation, or smart software that offers condition alerts and runtime history. Higher-end models often include SNMP, RS232, or Modbus communication protocols, which allow remote monitoring and predictive diagnostics. If your spec omits this, you risk systems that can’t alert you to declining battery performance until it’s too late.
Can a long recharge time affect system uptime in tenders?
Absolutely. Uptime planning isn’t just about runtime but also about how fast your system can return to a stable state. For example, if a UPS takes 8 hours to recharge but outages occur every 4–6 hours during storms, your protection may fail midway through a subsequent event. Recharge cycles need to be considered alongside runtime and load type when drafting resilience specifications.
Final Considerations for Recharge Time and UPS Uptime Planning
When you’re designing or evaluating a power continuity plan, UPS recharge time often gets overshadowed by runtime specs and kilowatt ratings. But overlooking it creates risk, particularly in tender scenarios where multiple outages, load variation, or limited maintenance windows are common.
A UPS that takes 8 hours to recover may perform well in isolation but fail operationally when paired with high-frequency power events. Just as you would match runtime to load type, you should match recharge dynamics to outage patterns and site risk. This is especially important when specifying systems for rail, healthcare, defence, or telecom where downtime has cascading consequences.
Planning for resilience means going beyond runtime. You need to ensure your battery infrastructure is not only robust but responsive. That includes:
Verifying recharge timelines
Understanding your monitoring capabilities
Choosing batteries with a design life and management architecture that matches your operational expectations
For project teams preparing tenders, now is the time to make sure those conditions are clearly reflected in your spec.
Resources
Download the UPS Tender Cheat Sheet →
A quick-reference toolkit highlighting frequent pitfalls in efficiency clauses. Designed to help engineers and consultants draft tender-ready documentation with confidence.
Submit Your Tender Spec for Review →
Share your in-progress specification, and our technical team will assess it for suitability against current performance, reliability, and operational benchmarks.
Download UPS Specification Template (Word Format) →
Includes pre-filled, editable clauses for runtime, diagnostics, energy efficiency and redundancy. For consultants preparing commercial or government UPS tenders.
Legend is a respected Australian company with trusted brands like CABAC and MSS Data Solutions. This partnership will allow us to offer you a broader range of products and services, while continuing the high standards you’ve come to rely on.
What’s Not Changing at PSS – The Important Stuff
While exciting things are happening behind the scenes, the things that matter most to you stay exactly the same:
Terrence Daniel remains our dedicated GM, continuing to lead with the same expertise and commitment you trust.
Existing PSS staff will continue to provide the high quality technical and customer support you’ve come to expect.
Warranties and service agreements will be fully honoured – nothing changes there.
And most importantly, our service promise remains rock-solid:
3 rings – We answer your call within 3 rings
3 days – We aim to deliver within 3 days
30 minutes – Quotes in 30 minutes or less
The transition will be complete by 1 August 2025.
As part of this transition, we’ll also be moving our pick-up locations into Legend Corporation’s facilities. From 4 August onwards, all order pick-ups will need to be made from the following addresses:
• NSW – 8 Distribution Place, Seven Hills
• WA – 6 Hunt St, Malaga
• VIC – Building 9/621 Whitehorse Rd, Mitcham
Rest assured, PSS’s fast 4-hour turnaround still applies, and our FIS rules remain unchanged.
Thank you to all of our existing customers for their ongoing support — we’re excited about this next chapter and the opportunities it brings.
If you have any questions, please reach out to our team.
Hunters Hill leads the list with an average of 1,290 customers interrupted per outage, followed by Lake Macquarie (834), Lane Cove (769), Ryde (754), and Central Coast (753).
Residents in the Lower North Shore face the longest disruptions, averaging 364 minutes, followed by Waverley (246 minutes), Mosman (234 minutes), Sydney (232 minutes), and Upper Hunter (224 minutes).
Lower North Shore (0.619), Hunters Hill (0.520), Port Stephens (0.460), Cessnock (0.424), and Lake Macquarie (0.417) have the highest impact scores.
The primary reasons for disruptions are equipment faults (796 incidents), environmental factors (707 incidents), and third-party activities (128 incidents).
Northern Beaches, Lane Cove, and Ryde are hotspots where multiple causes converge, resulting in higher cumulative impacts on households and businesses.
Electricity powers daily life in the homes and businesses of New South Wales. Yet when lights unexpectedly dim and appliances fall silent, communities grapple with the disruptive reality of power outages. This report investigates the data for 34 Local Government Areas across NSW and unveils the blackspots where outages strike most frequently and linger longest.
Drawing upon April 2023–March 2024 outage data from Ausgrid—Australia’s largest electricity distributor on the east coast—this analysis exposes patterns in the average number of customers interrupted and the duration of disruptions. Beyond the statistics, it illuminates the root causes: environmental factors like fierce storms and lightning, equipment malfunctions, third-party impacts such as accidental cable digs, operational errors, vandalism, and issues originating from customer installations.
Understanding these factors proves pivotal for residents, policymakers, and stakeholders committed to ameliorating the resilience of the electrical grid. By spotlighting the areas most affected and the reasons behind outages, this report seeks to inform and empower those invested in fortifying NSW’s electrical infrastructure against future blackouts.
NSW LGAs Ranked
By Average Power Outage Duration
Electricity disruptions across New South Wales reveal pronounced disparities among Local Government Areas. In Hunters Hill, each outage affects an average of 1,290 customers, yet power typically returns after 126 minutes, a relatively swift restoration compared to other regions.
In stark contrast, Lower North Shore grapples with the longest average outage duration, enduring 364 minutes (over six hours) per event, while impacting 365 customers. This prolonged downtime suggests unique challenges in this area, perhaps linked to complex infrastructure.
Intense service interruptions also occur in densely populated areas like Lake Macquarie and Lane Cove, where 834 and 769 consumers are affected per event, respectively. However, the duration of these power losses varies, with Lake Macquarie experiencing an average of 168 minutes without electricity, and Lane Cove averaging 116 minutes. This data hints at a correlation between population density and number of people impacted, though length of service interruptions doesn’t always correspond to the number of individuals affected.
An intriguing pattern surfaces when examining LGAs with lengthy outages but fewer people experiencing them. Areas such as Mosman and Upper Hunter endure power cuts lasting 234 minutes and 224 minutes on average, yet these events impact only 77 and 340 residents, respectively. Such discrepancies may reflect challenges specific to less densely populated or remote regions, including extended response times due to distance and accessibility of the grid.
Even major urban centres are not immune to extended power interruptions. Sydney experiences average downtimes of 232 minutes, affecting 452 customers per event. Similarly, Cumberland faces power losses lasting 201 minutes on average, impacting 632 consumers. These figures highlight that metropolitan areas, despite advanced electrical systems, can still be susceptible to massive disruptions.
Geographic Trends and Insights from Impact Scores
Geography reveals compelling insights into power outage patterns across New South Wales, especially when evaluating impact scores that balance average customer interruptions (ACI) and average power outage duration (APOD). Key findings emerge across urban hubs, coastal regions, and rural locales.
Urban Suburbs with High Impact Scores
Lower North Shore ranks highest with an impact score of 0.619, driven by the state’s longest average outage duration of 364 minutes despite fewer customer interruptions (365).
Hunters Hill follows closely with a score of 0.520, where 1,290 customers are interrupted per event, but outages last a shorter 126 minutes, reflecting dense urban infrastructure.
Sydney CBD and surrounding areas, such as Randwick (0.345) and Georges River (0.385), report high scores. While Sydney averages 232 minutes per outage with 452 customers affected, suburbs like Randwick and Georges River highlight both substantial interruption durations and moderately high customer impacts.
Coastal Regions with Elevated Impact Scores
Port Stephens leads the coastal regions with a score of 0.460, averaging 700 interruptions and 217 minutes of downtime. Coastal exposure likely amplifies vulnerability to environmental factors.
Lake Macquarie (0.417) and Central Coast (0.339) reflect similar patterns. While Lake Macquarie sees 834 customers affected, its outages are shorter at 168 minutes compared to Central Coast’s 146 minutes.
Suburban and Semi-Rural LGAs with Moderate Impacts
Ryde (0.336) and Northern Beaches (0.318) experience notable interruptions across multiple causes. Ryde averages 754 customers interrupted, while Northern Beaches records 662 interruptions, with outages lasting around 154 minutes.
Ku-ring-gai (0.306) and Hornsby (0.351) showcase moderate scores. Although fewer customers are impacted, outages persist over 172 minutes, underscoring infrastructure challenges in these suburban areas.
Rural and Remote Areas with Prolonged Disruptions
Upper Hunter (0.326) and Singleton (0.308) highlight rural challenges with extended outages, averaging 224 minutes and 217 minutes, respectively. However, fewer customers—340 in Upper Hunter and 330 in Singleton—are affected, indicating infrastructure delays in isolated regions.
Cessnock (0.424) exemplifies rural high-impact zones, where 738 customers are affected, with outages lasting 191 minutes.
Eastern Suburbs with Prolonged Durations but Lower Impact Scores
Waverley (0.302) and Mosman (0.238) endure some of the state’s longest disruptions, averaging 246 minutes and 234 minutes, respectively. Yet, smaller populations—175 in Waverley and 77 in Mosman—result in lower overall impact scores.
Lane Cove, though urban, ranks lower with a score of 0.285 despite 769 customer interruptions due to shorter durations of 116 minutes.
Key Geographic Patterns
Urban Density Drives Customer Impacts: LGAs with dense populations, like Hunters Hill and Lower North Shore, report major interruptions but not always the longest durations.
Coastal Vulnerabilities: Coastal LGAs such as Port Stephens and Lake Macquarie display high scores due to environmental exposure, including storms and salt corrosion.
Rural Response Delays: Remote areas like Upper Hunter and Cessnock face protracted outages despite affecting fewer customers, revealing challenges in maintenance and repair times.
Infrastructure Variability: Contrasts between neighbouring LGAs, such as Lower North Shore and Mosman, suggest uneven grid robustness and upkeep standards.
Examining Power Outage Causes Across NSW LGAs
Mitigating their impact of power outages demands an understanding of their causes. This section looks into the reasons behind electrical disruptions in New South Wales Local Government Areas and analyses trends based on the average number of customers affected and the typical duration of outages. Ausgrid identifies eight primary causes, each contributing uniquely to the challenges faced by the electrical grid.
Environmental Factors: Natural elements such as severe weather conditions—storms, floods, high winds—interfere with power lines and infrastructure, leading to widespread outages.
Equipment Faults: Failures within transformers, switches, or other electrical components result in service interruptions, often requiring technical repairs or replacements.
Third-Party: Actions by external suppliers, including maintenance work or operational errors, can inadvertently disrupt the power supply to consumers.
Operating Faults: Mistakes or malfunctions during the operation of the grid, such as incorrect settings or procedural errors, cause unintended outages.
Lightning: Strikes from lightning directly impact power lines or equipment, causing immediate and sometimes extensive service disruptions.
Vandalism: Deliberate damage inflicted on electrical infrastructure—such as cutting lines or damaging substations—leads to unexpected outages and poses safety risks.
Cable Digs: Accidental severing of underground cables during excavation or construction projects interrupts the flow of electricity to affected areas.
Customer Installation Issues: Problems originating from consumer-owned equipment or improper installations contribute to localised outages, affecting individual or small groups of customers.
Environmental Factors
High Customer Impact in Urban Areas
Bayside leads with an average of 1,206 customers interrupted, enduring outages lasting 144 minutes.
Cessnock follows with 996 customers affected, with outages persisting for 184 minutes.
South Sydney endures the longest average outage duration at 400 minutes, affecting 130 customers. Prolonged downtimes suggest challenges unique to this area, possibly due to infrastructure issues.
Upper Hunter faces outages lasting 322 minutes on average, impacting 358 customers. Extended durations hint at potential delays in restoration efforts in rural settings.
St George experiences blackouts averaging 303 minutes, affecting 87 customers.
Moderate Impact with Varied Durations
Hornsby sees an average of 645 customers interrupted, with outages lasting 148 minutes.
Central Coast has 583 customers affected, enduring blackouts for 166 minutes.
Port Stephens impacts 491 customers, but with a longer average duration of 225 minutes.
Shortest Outage Durations
Lane Cove enjoys the shortest average outage duration at 89 minutes, affecting 230 customers.
Scone also has relatively brief outages lasting 92 minutes, impacting 190 customers.
Newcastle experiences interruptions for 105 minutes, with 387 customers affected.
Key Insights
Urban Centers with High Customer Impact: Densely populated LGAs like Bayside and Cessnock report the highest average number of customers interrupted, emphasising need for robust infrastructure in metropolitan areas.
Rural Areas with Extended Durations: Regions such as South Sydney and Upper Hunter face much longer outages despite fewer customers affected, indicating possible logistical challenges in restoring power promptly.
Variation in Outage Durations: Disparities in outage durations across LGAs suggest differences in infrastructure resilience and response effectiveness. For instance, Port Stephens experiences longer outages compared to Northern Beaches, despite both being coastal regions.
No Direct Correlation Between Customers Interrupted and Outage Duration: Some LGAs with high customer interruptions have shorter outages, while others with fewer customers experience longer blackouts.
Equipment Faults
High Customer Impact in Urban Centres
Lane Cove tops the list with an average of 1,503 customers interrupted, enduring outages lasting 117 minutes. This substantial figure reflects dense populations and possibly ageing infrastructure in urban areas.
Lake Macquarie follows closely, affecting 1,306 customers per outage, with an average duration of 158 minutes.
Hunters Hill experiences interruptions impacting 1,222 customers, yet boasts the shortest outage duration among the top LGAs at 41 minutes. Quick restoration times here may indicate efficient response mechanisms.
Extended Outages in Specific Regions
Lower North Shore endures the longest average outage duration at 528 minutes, affecting 767 customers. Such prolonged downtimes suggest unique challenges in this area, potentially due to complex infrastructure or accessibility issues.
Woollahra and Mosman also face lengthy outages, averaging 363 minutes and 336 minutes respectively, while impacting fewer customers (167 and 78). These extended durations might be attributed to localised infrastructure constraints.
Cumberland sees an average of 922 customers interrupted, with outages persisting for 195 minutes.
Georges River affects 824 customers, enduring blackouts for 226 minutes.
Ku-ring-gai impacts 753 customers, but has a shorter average duration of 80 minutes, suggesting efficient outage management.
Shortest Outage Durations
Hunters Hill boasts the shortest average outage duration at 41 minutes, despite a high number of customers affected.
Ku-ring-gai and St George also have relatively brief outages lasting 80 minutes and 100 minutes, impacting 753 and 624 customers respectively.
South Sydney experiences interruptions for 115 minutes, with 439 customers affected.
Key Insights
Urban Centres with High Customer Impact: Densely populated LGAs like Lane Cove and Lake Macquarie report the highest average number of customers interrupted, emphasising need for robust infrastructure and proactive maintenance in metropolitan areas.
Prolonged Outages in Certain Areas: Regions such as Lower North Shore and Woollahra face much longer outages, indicating challenges in infrastructure resilience or emergency response effectiveness.
Efficiency in Restoration: Some LGAs like Hunters Hill manage to restore power swiftly despite high customer impact, highlighting effective outage management practices.
No Direct Correlation Between Customers Interrupted and Outage Duration: Variations exist where some areas with high customer interruptions have shorter outages, while others with fewer customers experience longer blackouts.
Third-Party
High Customer Impact with Moderate Durations
Port Stephens stands out, with an average of 1,402 customers interrupted, enduring outages lasting 135 minutes. This substantial impact suggests that disruptions here affect a large population, possibly due to critical infrastructure dependencies.
Central Coast follows, affecting 653 customers per outage, with an average duration of 215 minutes. The longer restoration time indicates complexities in addressing supplier-related issues in this region.
Extended Outages in Urban Centres
Sydney experiences the longest average outage duration at 542 minutes, affecting 80 customers. Although fewer individuals are impacted, the extended downtime suggests considerable challenges in resolving these disruptions within the urban infrastructure.
Ryde faces blackouts lasting 416 minutes on average, interrupting service for 336 customers. The combination of high customer impact and prolonged duration underscores the need for efficient coordination with third-party suppliers in this area.
Moderate Impact with Varied Durations
Newcastle affects 189 customers, with outages persisting for 345 minutes. Lengthy durations hint at potential logistical challenges in restoration efforts.
Lower North Shore sees interruptions impacting 145 customers, enduring outages of 329 minutes on average.
Ku-ring-gai experiences outages lasting 315 minutes, affecting 84 customers. Extended downtimes here may reflect complexities in supplier networks or infrastructure.
Shortest Outage Durations
Sutherland enjoys the shortest average outage duration at 109 minutes, affecting 91 customers. Efficient restoration practices may contribute to quicker recovery times in this LGA.
Georges River and Woollahra also have relatively brief outages lasting 125 minutes and 126 minutes, impacting 314 and 89 customers respectively.
Key Insights
High Impact Areas: LGAs like Port Stephens and Central Coast report the highest average number of customers interrupted, emphasising the importance of robust contingency planning in these regions.
Extended Durations in Certain LGAs: Urban centres such as Sydney and Ryde face significantly longer outages, indicating potential complexities in urban infrastructure and the need for improved collaboration with third-party suppliers.
Variation in Outage Durations: Disparities across LGAs suggest differences in response effectiveness and infrastructure resilience. For instance, Sutherland manages to restore power more swiftly compared to other regions.
No Direct Correlation Between Customers Interrupted and Outage Duration: Some LGAs with high customer interruptions have moderate outage durations, while others with fewer customers experience prolonged blackouts.
Operating Faults
High Customer Impact with Short Durations
Ryde experiences an average of 8,724 customers interrupted, with outages lasting a mere 24 minutes. Such a high number of affected individuals suggests that operating faults here disrupt large portions of the grid, but swift restoration efforts keep downtime minimal.
Hunters Hill follows, impacting 2,568 customers per outage, with an even shorter average duration of 16 minutes. Rapid recovery times indicate efficient response mechanisms mitigating the effects of these faults.
Moderate Customer Impact with Varying Durations
Singleton sees interruptions affecting 974 customers, enduring outages for 88 minutes. Longer restoration times compared to Ryde and Hunters Hill may point to differences in infrastructure or response strategies.
Muswellbrook affects 871 customers, but enjoys the shortest average outage duration at 8 minutes. Quick recovery highlights effective management of operating faults in this region.
Northern Beaches experiences outages impacting 679 customers, with an average duration of 83 minutes.
Extended Outages with Fewer Customers Affected
Ku-ring-gai endures the longest average outage duration at 282 minutes, yet only 53 customers are interrupted. Prolonged downtimes affecting a small number may indicate localised issues that are complex to resolve.
Hornsby faces blackouts lasting 194 minutes, affecting 450 customers. Extended durations here suggest challenges in restoring service promptly.
Georges River experiences outages of 165 minutes, impacting 68 customers.
Shortest Outage Durations
Muswellbrook boasts the shortest average outage duration at 8 minutes, despite affecting 871 customers.
Hunters Hill and Ryde also have brief outages lasting 16 minutes and 24 minutes, impacting 2,568 and 8,724 customers respectively.
Key Insights
High Impact Areas with Rapid Recovery: LGAs like Ryde and Hunters Hill report the highest average number of customers interrupted but maintain short outage durations, highlighting efficient fault management and swift restoration processes.
Prolonged Outages in Certain LGAs: Regions such as Ku-ring-gai and Hornsby face much longer outages, despite fewer customers being affected. This pattern suggests complex issues in specific parts of the network that require more time to address.
Variation in Outage Durations: Disparities across LGAs indicate differences in infrastructure resilience and response effectiveness. For instance, Muswellbrook achieves quick restoration times, while Northern Beaches experiences longer downtimes.
No Direct Correlation Between Customers Interrupted and Outage Duration: Some areas with high customer interruptions have short outages, while others with fewer customers endure prolonged blackouts.
Lightning
High Customer Impact with Short Durations
Northern Beaches experiences the highest average number of customers interrupted due to lightning, with 6,787 customers affected per outage. Despite this substantial impact, outages here last an average of only 68 minutes, indicating efficient restoration efforts in this region.
Canterbury Bankstown follows, with 2,335 customers impacted per outage, enduring average durations of 140 minutes. This suggests that while many residents are affected, restoration takes longer compared to Northern Beaches.
Hornsby sees 2,004 customers interrupted per outage, with blackouts lasting around 157 minutes on average.
Moderate Customer Impact with Varied Durations
Lane Cove has an average of 1,595 customers affected per outage, with relatively brief durations averaging 66 minutes.
Cessnock experiences outages impacting 1,441 customers, with an average duration of 131 minutes.
Newcastle and Maitland both have over 1,200 customers affected per outage, with durations of 178 minutes and 113 minutes respectively.
Low Customer Impact with Extended Durations
Port Stephens stands out with the longest average outage duration of 360 minutes, yet it affects only 61 customers per outage. This prolonged downtime suggests challenges in restoration efforts in this LGA, possibly due to infrastructure limitations or geographical factors.
Singleton experiences blackouts of 199 minutes, affecting 127 customers.
Shortest Outage Durations
Sutherland enjoys the shortest average outage duration at 57 minutes, despite affecting 1,234 customers per outage. Efficient restoration practices may contribute to quicker recovery times in this area.
Lane Cove and Northern Beaches also have relatively brief outages, lasting 66 minutes and 68 minutes respectively, while impacting 1,595 and 6,787 customers.
Key Insights
High Impact Areas with Efficient Recovery: LGAs like Northern Beaches and Sutherland report high numbers of customers interrupted but maintain short outage durations, highlighting effective response strategies against lightning-induced disruptions.
Extended Outages in Certain Regions: Areas such as Port Stephens and Ku-ring-gai face much longer outages, indicating potential challenges in infrastructure resilience or difficulties in accessing affected sites for repairs.
Variation in Outage Durations Across LGAs: Disparities suggest differences in preparedness and response capabilities. For instance, Canterbury Bankstown and Hornsby experience longer outages compared to Lane Cove, despite all having high customer impacts.
No Direct Correlation Between Customers Interrupted and Outage Duration: Some LGAs with a high number of customers affected have short outage durations, while others with fewer customers experience prolonged blackouts.
Vandalism
High Customer Impact with Varied Durations
Newcastle experiences the highest average number of customers interrupted due to vandalism, with 1,046 customers affected per incident. Outages here last an average of 62 minutes, indicating efficient restoration efforts despite the substantial impact.
Waverley follows, affecting 398 customers per outage but endures the longest average outage duration of 600 minutes. This prolonged downtime suggests significant challenges in addressing vandalism-related damages within this area.
Moderate Impact with Short Durations
Lake Macquarie sees an average of 156 customers interrupted, with outages lasting 64 minutes. The relatively brief duration hints at effective response mechanisms mitigating the effects of vandalism.
Port Stephens affects 123 customers per incident, experiencing outages with an average duration of 34 minutes, the shortest among the LGAs analysed. Swift restoration efforts here minimise the impact on residents.
Lower Impact and Rapid Recovery
Maitland reports 81 customers interrupted on average, with outages lasting 112 minutes. While the number of affected customers is lower, the duration is moderately extended compared to other regions.
Cessnock has the lowest average number of customers interrupted due to vandalism, with 54 customers affected per incident. Outages here are resolved swiftly, lasting just 16 minutes, the briefest duration recorded.
Key Insights
Significant Disparities in Outage Durations:Waverley stands out with an exceptionally long average outage duration of 600 minutes, despite affecting fewer customers than Newcastle. This indicates potential complexities in repairing vandalism-induced damages or challenges in accessing affected infrastructure.
Efficiency in Restoration Efforts: LGAs like Port Stephens and Cessnock demonstrate rapid recovery times, with outages lasting 34 minutes and 16 minutes respectively. Effective strategies in these areas reduce the impact of vandalism on the power supply.
No Direct Correlation Between Customers Interrupted and Outage Duration: While Newcastle has the highest number of customers affected, the outage duration is relatively short. Conversely, Waverley affects fewer customers but endures much longer outages.
Need for Enhanced Security Measures: The substantial impact of vandalism on power outages, especially in areas like Waverley and Newcastle, underscores the necessity for improved security and preventive measures to safeguard electrical infrastructure.
Cable Dig
High Customer Impact with Moderate Durations
Newcastle experiences the highest average number of customers interrupted due to cable digs, with 1,793 customers affected per incident. Outages here last an average of 108 minutes, indicating efficient restoration efforts despite the substantial impact.
Cumberland follows, affecting 1,611 customers per outage, with an average duration of 141 minutes. The longer restoration time suggests complexities in repairing underground infrastructure in this region.
Inner West sees 1,569 customers interrupted on average, with outages lasting 77 minutes, the shortest duration among the top high-impact LGAs.
Lake Macquarie impacts 1,525 customers per incident, with outages averaging 80 minutes in duration.
Extended Outages in Specific Areas
Lower North Shore endures the longest average outage duration at 477 minutes, affecting 632 customers per incident. Such prolonged downtimes suggest heavy challenges in accessing and repairing underground cables in this area.
Sydney experiences outages lasting 341 minutes on average, impacting 787 customers. The extended duration indicates potential complexities within the urban infrastructure when addressing cable dig-related damages.
Bayside faces outages with an average duration of 345 minutes, affecting 72 customers. Although fewer customers are impacted, the lengthy restoration time highlights challenges in resolving these incidents promptly.
Moderate Impact with Varied Durations
Willoughby reports 281 customers interrupted per outage, with the shortest average duration of 37 minutes. Efficient response efforts contribute to rapid restoration in this LGA.
Muswellbrook experiences outages affecting 62 customers, lasting 240 minutes on average. The extended duration may reflect challenges in accessing remote or less densely populated areas.
Woollahra and Randwick have similar numbers of customers affected—60 and 58 respectively—but differ in outage durations, with Woollahra averaging 103 minutes and Randwick243 minutes.
Key Insights
Significant Disparities in Outage Durations: LGAs like Lower North Shore and Bayside endure exceptionally long average outage durations, indicating potential difficulties in repairing underground cables in densely populated or urbanised areas.
High Impact Areas with Efficient Recovery: Despite high numbers of customers affected, regions such as Newcastle and Inner West manage to restore power relatively quickly, suggesting effective emergency response protocols.
Challenges in Urban Centers: Extended outage durations in Sydney highlight the complexities of addressing cable dig incidents within metropolitan infrastructure.
No Direct Correlation Between Customers Interrupted and Outage Duration: Some LGAs with a high number of customers affected experience shorter outages, while others with fewer customers endure prolonged downtimes.
Customer Installation
Highest Customer Impact with Moderate Durations
Inner West experiences the highest average number of customers interrupted due to customer installation issues, affecting 122 customers per incident. Outages here last an average of 136 minutes, indicating a moderate restoration time.
Waverley follows, impacting 101 customers per outage, with a shorter average duration of 80 minutes. Swift recovery efforts contribute to minimising the impact on residents.
Extended Outages with Fewer Customers Affected
Bayside endures the longest average outage duration at 318 minutes, affecting 58 customers per incident. The prolonged downtime suggests considerable challenges in resolving customer installation issues within this area.
Lower North Shore experiences outages lasting 249 minutes on average, impacting 95 customers. Extended durations here may reflect complexities in addressing installation problems in this LGA.
Moderate Impact with Varied Durations
Sydney sees 82 customers interrupted per outage, with a shorter duration of 80 minutes. Efficient response mechanisms may contribute to rapid restoration in the metropolitan area.
Northern Beaches affects 62 customers per incident, experiencing outages with an average duration of 149 minutes. The longer restoration time indicates potential challenges in resolving customer equipment issues promptly.
Key Insights
Significant Disparities in Outage Durations: LGAs like Bayside and Lower North Shore endure significantly longer outage durations compared to others, despite affecting fewer customers. This suggests that customer installation issues in these areas are more complex or require more time to resolve.
Efficiency in Restoration Efforts: Regions such as Waverley and Sydney demonstrate rapid recovery times, with outages lasting 80 minutes, despite affecting a moderate number of customers. Effective response strategies help minimise the impact of customer installation issues.
No Direct Correlation Between Customers Interrupted and Outage Duration: Some LGAs with a higher number of customers affected experience shorter outages, while others with fewer customers endure prolonged downtimes.
Need for Enhanced Customer Awareness: The impact of customer installation issues on power outages underscores the necessity for increased education and support for consumers regarding proper equipment maintenance and installation practices.
Overall Causal Insights
Causes with the Most Significant Impact
Environmental Causes
Bayside and Cessnock are heavily impacted by environmental factors, with average customer interruptions of 1,206 and 996 respectively.
Outage durations in these areas are substantial, averaging 144 minutes for Bayside and 184 minutes for Cessnock.
Equipment Failures
Lane Cove leads in customer interruptions due to equipment failures, affecting an average of 1,503 customers per incident.
Lake Macquarie and Hunters Hill also experience high impacts, with 1,306 and 1,222 customers affected respectively.
While Hunters Hill enjoys a swift average restoration time of 41 minutes, Lower North Shore endures prolonged outages lasting 528 minutes.
Lightning Strikes
Northern Beaches faces exceptional impact from lightning, with an average of 6,787 customers interrupted per event.
Canterbury Bankstown and Hornsby also suffer significant effects, impacting 2,335 and 2,004 customers on average.
Causes with Prolonged Durations
Operating Faults
Ryde stands out with a remarkable 8,724 customers affected per outage, yet the average duration is a brief 24 minutes.
In contrast, Ku-ring-gai experiences extended outages lasting 282 minutes, despite a lower customer impact of 53 individuals.
Cable Digs
Lower North Shore endures the longest outages due to cable digs, averaging 477 minutes and affecting 632 customers.
Sydney also faces lengthy disruptions, with outages lasting 341 minutes and impacting 787 customers.
Vandalism
Waverley suffers from extreme outage durations averaging 600 minutes, interrupting service for 398 customers.
Newcastle has the highest customer impact from vandalism, with 1,046 customers affected, but enjoys a shorter average outage duration of 62 minutes.
Notable Regional Patterns
Northern Beaches
Consistently appears across multiple causes with high customer impacts, notably from lightning (6,787 customers) and operating faults (679 customers).
Generally shorter outage durations suggest efficient restoration efforts in this region.
Lake Macquarie
Faces significant challenges across several causes, including equipment failures (1,306 customers) and cable digs (1,525 customers).
Also affected by environmental factors and vandalism, indicating a need for comprehensive infrastructure assessment.
Inner West
Experiences moderate to high impacts from various causes, such as cable digs (1,569 customers) and customer installation issues (122 customers).
Relatively short outage durations imply effective response protocols.
Vandalism:Newcastle (High impact: 1,046 customers; Short duration: 62 minutes).
Recommendations
Targeted Infrastructure Improvements
Prioritise Northern Beaches, Lane Cove, and Ryde for infrastructure upgrades and preventive measures due to their high customer impacts across multiple causes.
Address prolonged restoration challenges in Waverley for vandalism-related outages and in Lower North Shore for cable dig incidents.
Enhanced Maintenance Plans
Develop specific maintenance strategies for Lake Macquarie and Newcastle, which demonstrate high impacts across various disruption types.
Incident-Specific Protocols
Implement lightning mitigation strategies in Northern Beaches and Lane Cove to reduce high customer impacts from lightning strikes.
Improve response times for vandalism incidents in Waverley to minimise extended outages.
Stakeholder Engagement
Educate local councils and communities in heavily affected LGAs about preventive measures and emergency preparedness.
Collaborate with third-party suppliers and construction firms to reduce cable dig incidents, especially in Sydney and Lower North Shore.
Quarterly Analysis of Power Outage Trends
April 2023 to June 2023
Temporal Patterns and Peak Periods
Between April and June 2023, numerous power outages disrupted various Local Government Areas (LGAs) in New South Wales. A notable concentration of incidents occurred in May, particularly from the 10th to the 21st, suggesting a possible link to seasonal factors or weather conditions during this timeframe.
Frequent Causes and Affected LGAs
Equipment Faults emerged as the predominant cause, accounting for a substantial portion of outages across multiple LGAs. Canterbury Bankstown experienced frequent incidents, with outages occurring almost weekly, impacting up to 1,693 customers in a single event on May 13th. Similarly, Central Coast faced numerous equipment-related disruptions, notably affecting over 8,038 customers on May 30th.
Environmental Factors influenced areas like Northern Beaches and Hornsby, where storms and adverse weather likely contributed to service interruptions. For instance, the Northern Beaches encountered a major environmental outage impacting 2,075 customers on June 12th.
Third-Party Interferences, such as cable digs and external supplier activities, led to prolonged outages in LGAs like Ryde and Lower North Shore. On May 22nd, Ryde experienced an outage lasting 1,043 minutes due to third-party causes, affecting 96 customers.
Time-of-Day Trends
Outages frequently occurred during daytime hours, particularly between 9 AM and 5 PM, coinciding with peak operational periods and reflecting increased demand on the grid. However, major incidents also took place during early morning hours, indicating that equipment faults are not confined to peak usage times.
Notable Observations
Ryde experienced an exceptionally high customer impact due to operating faults, with 2,568 customers affected on June 20th, albeit with a brief outage duration of 16 minutes.
Lake Macquarie faced an equipment fault on May 17th affecting a staggering 35,110 customers, though the outage lasted only 56 minutes, demonstrating efficient restoration efforts despite the large scale.
Lightning caused prolonged outages in Port Stephens, with an incident on May 26th lasting 360 minutes, although impacting only 61 customers.
Impact of Vandalism and Cable Digs
Vandalism led to significant disruptions in Waverley, where an outage on May 18th lasted 605 minutes, affecting 71 customers.
Cable Digs resulted in prolonged outages in Woollahra and Randwick, with incidents on May 30th and June 22nd lasting 114 minutes and 385 minutes respectively.
Seasonal and Weather-Related Trends
A high frequency of environmental outages occurred during April and May, possibly due to seasonal weather patterns such as increased rainfall or storms during autumn. LGAs like Central Coast and Sutherland witnessed multiple environmental incidents during these months.
July 2023 to September 2023
Seasonal Patterns and Peak Periods
Between July and September 2023, numerous power outages disrupted various Local Government Areas (LGAs) across New South Wales. A high concentration of incidents occurred during August, especially in mid-month, suggesting possible links to seasonal weather conditions, such as winter storms or increased rainfall during this period.
Frequent Causes and Affected LGAs
Equipment Faults emerged as the predominant cause, accounting for a substantial portion of outages across multiple LGAs. Central Coast experienced frequent incidents, with outages occurring almost weekly, impacting up to 3,258 customers in a single event on July 6th. Similarly, Canterbury Bankstown faced numerous equipment-related disruptions, notably affecting over 2,013 customers on August 18th.
Environmental Factors influenced areas like Northern Beaches and Hornsby, where storms and adverse weather likely contributed to service interruptions. For instance, the Northern Beaches encountered a major environmental outage impacting 1,762 customers on September 20th.
Third-Party Interferences, such as cable digs and external supplier activities, led to prolonged outages in LGAs like Lower North Shore and Ryde. On August 21st, Ryde experienced an outage lasting 74 minutes due to third-party causes, affecting 1,097 customers.
Time-of-Day Trends
Outages frequently occurred during daytime hours, particularly between 9 AM and 5 PM, coinciding with peak operational periods and reflecting increased demand on the grid. However, major incidents also took place during early morning hours, indicating that equipment faults are not confined to peak usage times.
Notable Observations
Ryde experienced an exceptionally high customer impact due to operating faults, with 13,969 customers affected on August 14th, albeit with a brief outage duration of 28 minutes.
Lake Macquarie faced an equipment fault on August 15th affecting 867 customers, lasting 116 minutes, demonstrating challenges in restoration efforts despite the scale.
Lightning caused prolonged outages in Newcastle, with an incident on September 28th lasting 109 minutes, impacting 3,563 customers.
Impact of Vandalism and Cable Digs
Vandalism led to disruptions in Cessnock, where an outage on September 18th lasted 16 minutes, affecting 54 customers.
Cable Digs resulted in prolonged outages in Sydney and Willoughby, with incidents on July 17th and August 8th lasting 110 minutes and 37 minutes respectively.
Seasonal and Weather-Related Trends
A higher frequency of environmental outages occurred during August, possibly due to winter weather patterns such as storms or high winds. LGAs like Central Coast and Hornsby witnessed multiple environmental incidents during this month.
October 2023 to November 2023
Seasonal Patterns and Peak Periods
Environmental factors highly influenced outages during this period, likely due to spring and early summer weather conditions. Notably, a surge in incidents occurred in mid-December, possibly linked to increased thunderstorms and heat-related stresses on infrastructure.
Frequent Causes and Affected LGAs
Environmental Causes dominated many LGAs, particularly in the Central Coast, which experienced numerous outages affecting over 9,515 customers on December 14th. Canterbury Bankstown faced significant environmental disruptions, with an outage on October 16th impacting 1,639 customers for 400 minutes.
Equipment Faults remained a prevalent issue. Canterbury Bankstown witnessed frequent equipment-related outages, including an incident on October 6th affecting 2,287 customers. Similarly, the Northern Beaches faced substantial equipment faults, with a notable event on December 18th disrupting service for 2,068 customers for 201 minutes.
Lightning Strikes caused notable outages in Canterbury Bankstown, where an incident on December 27th affected 3,200 customers. Singleton and Newcastle also experienced lightning-induced disruptions, emphasising the need for lightning protection measures.
Third-Party Interferences, such as cable digs and unauthorised activities, led to prolonged outages in areas like Sydney and the Lower North Shore. A significant cable dig incident in Sydney on November 2nd resulted in an outage lasting 858 minutes, impacting 67 customers.
Time-of-Day Trends
Outages frequently occurred during afternoon and evening hours, between 2 PM and 8 PM, coinciding with peak electricity usage and possibly reflecting the grid’s vulnerability under high demand. However, several incidents also took place during early morning hours, indicating that equipment faults and environmental factors are not confined to peak times.
Notable Observations
Central Coast faced one of the most prolonged outages due to environmental causes on December 9th, affecting 1,827 customers for 991 minutes.
Hornsby experienced an environmental outage on October 15th impacting 1,985 customers for 161 minutes, suggesting severe weather conditions in that area.
Port Stephens dealt with an equipment fault on November 19th that lasted 2,017 minutes, affecting 688 customers, highlighting major restoration challenges.
Impact of Vandalism and Cable Digs
Vandalism led to disruptions in Maitland, with multiple incidents in October affecting services for durations up to 217 minutes.
Cable Digs resulted in extensive outages in Sydney and the Lower North Shore. The incident in Sydney on October 31st affected 1,700 customers for 56 minutes, while in the Lower North Shore, a cable dig on November 4th impacted 736 customers for 95 minutes.
Seasonal and Weather-Related Trends
A spike in environmental outages occurred during late November and December, likely due to the storm season in NSW. Thunderstorms, high winds, and lightning contributed to the increased number of outages, particularly in LGAs like Canterbury Bankstown, Central Coast, and the Northern Beaches.
January 2024 to March 2024
Seasonal Patterns and Peak Periods
High temperatures and summer storms during these months likely contributed to the increased number of environmental and equipment faults. Notably, mid-February witnessed a surge in incidents, suggesting a correlation with extreme weather events characteristic of late summer.
Frequent Causes and Affected LGAs
Equipment Faults remained a predominant cause of disruptions. Canterbury Bankstown experienced significant outages due to equipment issues, with a major incident on March 6th affecting 2,808 customers for 101 minutes. Similarly, the Northern Beaches faced substantial equipment-related outages, including one on February 8th impacting 3,095 customers.
Environmental Factors played a crucial role, particularly in LGAs like Hornsby and the Central Coast. On February 19th, Hornsby suffered an environmental outage affecting 1,524 customers for 88 minutes, coinciding with severe weather conditions.
Lightning Strikes caused notable disruptions, especially on February 19th, where the Northern Beaches saw 13,321 customers without power due to lightning for 85 minutes. This underscores the vulnerability of the grid to natural phenomena during storm seasons.
Third-Party Interferences, such as cable digs and unauthorised activities, led to massive outages in areas like the Inner West and Lake Macquarie. On February 2nd, a cable dig in Lake Macquarie resulted in an outage affecting 1,525 customers for 80 minutes.
Time-of-Day Trends
Outages frequently occurred during afternoon and early evening hours, between 2 PM and 8 PM, aligning with peak electricity usage and strain on infrastructure. However, numerous incidents also took place during early morning hours, indicating that equipment faults and environmental factors can impact the grid at any time.
Notable Observations
Inner West experienced a major equipment fault on January 24th, affecting 15,819 customers for 111 minutes, highlighting substantial challenges in urban grid management.
Lake Macquarie faced a major equipment fault on March 14th, impacting 8,260 customers for 82 minutes, emphasising the need for infrastructure resilience in that area.
Canterbury Bankstown had multiple equipment faults on February 29th, with several incidents occurring on the same day, suggesting possible systemic issues.
Impact of Vandalism and Cable Digs
Vandalism led to disruptions in Port Stephens and Waverley. On March 6th, vandalism in Port Stephens caused an outage affecting 105 customers for 35 minutes. Similarly, Waverley experienced a vandalism-induced outage on March 3rd, impacting 398 customers for 600 minutes.
Cable Digs resulted in prolonged outages in Randwick and the Inner West. On February 29th, a cable dig in Randwick led to an outage affecting 55 customers for 100 minutes.
Seasonal and Weather-Related Trends
The summer months of January to March are characterised by high temperatures, bushfire risks, and severe thunderstorms in NSW. The data reflects this, with increased environmental and lightning-related outages during this period. LGAs like the Northern Beaches, Hornsby, and the Central Coast were notably affected, indicating that these areas may be more susceptible to weather-related disruptions.
Methodology
PSS Distributors sourced quarterly outage records, spanning April 2023 to March 2024, from Ausgrid. Localities listed within the datasets were matched to LGAs to create a structured lens through which disruptions could be dissected. A systematic sorting of entries by LGAs enabled clear insights into geographic patterns. From there, two critical metrics emerged: the average number of customers impacted and the mean duration of interruptions—calculated after parsing raw figures using Excel’s capabilities.
To compute the Impact Score, a calculated metric balancing average customer impact (ACI) and average power outage duration (APOD), PSS Distributors employed a normalisation process to ensure consistency across diverse datasets and facilitate meaningful comparisons between Local Government Areas (LGAs). The first step was converting raw ACI and APOD values into normalised scores on a scale of 0 to 1 so as to allow disparate scales—total customer interruptions and outage durations—to align for balanced analysis. Assigning equal weightage to both ACI and APOD ensured neither metric disproportionately influenced the results. The final Impact Score for each LGA was then calculated as the average of the normalised values.
Probing into root causes, the frequency of outage triggers—whether environmental events, equipment issues, or third-party incidents—was quantified through Excel’s Find All feature. This granular approach revealed underlying trends that helped shape a broader understanding of outage dynamics.
PSS has distributed Uninterruptible Power Supplies for 30 years and offers a broad range suitable for every application. Call us at 1300 882 447 or e-mail sales@pssdistributors.com.au to find the right solution for your needs.
At PSS Distributors, we’re committed to innovation and reliability in power solutions, especially for critical medical applications. That’s why we’re excited to announce the latest addition to our Medi-X range: lithium-ion UPS modules! These advanced systems offer unparalleled performance, extended run times, and peace of mind for safeguarding temperature-sensitive medical supplies.
The Evolution of Battery Technology
Our Medi-X range has long been a trusted choice for medical refrigeration power backup, offering 5-year design life and 10-year long-life (LL) battery options. Now, we’ve expanded our lineup with two brand-new lithium-ion UPS models: the MediX-3-4-LITH and MediX-3-12-LITH. These cutting-edge systems take reliability to the next level, offering:
Longer Battery Life: Lithium-ion technology ensures a longer operational lifespan compared to traditional batteries.
Enhanced Performance: Superior energy density allows for compact designs and extended runtimes.
Greater Efficiency: Fast recharge times to minimize downtime after a power outage.
Tailored Solutions for Major Fridge Brands
We’ve made it easy to find the right solution for your medical refrigeration needs. Our Medi-X page now includes detailed runtime charts for all major fridge manufacturers, including the latest lithium-ion models. Whether you’re using a standard or high-capacity refrigerator, the Medi-X lithium range ensures your medical supplies stay protected.
*click table to take to view all run times
Not seeing your fridge model listed? Contact us! Our team can provide custom run times or help you select the ideal UPS solution for your specific requirements.
A Step Forward in Collaboration
The launch of our lithium-ion range also coincides with an exciting partnership. PSS Distributors is proud to collaborate with EuroChill to introduce a revolutionary fridge with a built-in UPS, powered by lithium-ion batteries. This innovative solution combines reliability and convenience, ensuring uninterrupted performance in one seamless unit.
Ready to Upgrade?
With our new lithium-ion Medi-X models, you’re investing in the future of medical refrigeration power backup. Explore the Medi-X range today and ensure your facility is prepared for any power disruption.
Visit our Medi-X page for more details, or learn about our collaboration with EuroChill here.
In the medical industry, maintaining the precise temperature range for refrigerated vaccines is not just important—it’s critical. While some fluctuations in temperature are inevitable, what matters most is that these fluctuations remain within the safe range of 2 to 8 degrees Celsius. Any deviation outside of this range can compromise the efficacy of these life-saving materials. That’s why at PSS, we’ve integrated a UPS system directly into our Vacc-Safe PowerGuard Fridge, ensuring that your vaccines remain safe, even in the event of a power failure. But we didn’t just stop at design; we rigorously tested our fridge to confirm its reliability. Here’s what we found.
Testing Overview
Our energy tests began with the Vacc-Safe PowerGuard Fridge at room temperature. Over a controlled period, we monitored its energy consumption as the fridge brought its internal environment down to the crucial range of 2 to 8 degrees Celsius. This phase is particularly important because it simulates real-world conditions where the fridge might be operating for the first time or after an extended period of being offline.
Maintaining the Perfect Temperature
Once the fridge reached the target temperature range, we allowed it to stabilize. To assess its performance under realistic conditions, we introduced a common but significant variable—opening the fridge door. At the end of the testing period, just before 8 AM, we opened the door to observe how the fridge responded in terms of energy consumption and temperature fluctuation.
Our tests specifically measured how much energy was required to maintain temperature stability after this disruption. The results were promising: even with the door being opened, the integrated UPS ensured that the fridge continued to operate smoothly, with only a minimal increase in energy consumption, and crucially, the internal temperature remained within the safe range.
Reliable Performance
Throughout the entire test, from the fridge’s initial cooling phase to the final door opening, the Vacc-Safe PowerGuard Fridge demonstrated exceptional stability. The integrated UPS system provided a seamless transition during simulated power interruptions, ensuring that the fridge’s internal temperature remained within the safe range at all times.
Why This Matters
In the healthcare industry, maintaining the correct temperature range can have serious consequences. Vaccines and other temperature-sensitive materials must be stored within strict parameters to maintain their effectiveness. The Vacc-Safe PowerGuard Fridge, equipped with an integrated UPS, not only meets but exceeds these requirements, offering peace of mind to healthcare providers.
Our energy testing confirms that this fridge is not just another piece of equipment—it’s a critical part of your vaccine storage strategy. When every degree within the safe range matters, trust Vacc-Safe to keep your materials protected.
When building a high physical support house, ensuring a reliable battery backup system is critical. Uninterruptible Power Supply (UPS) systems in these homes are essential to guarantee that vital devices such as medical equipment, emergency doors, and communication systems continue to function during power outages. For NDIS high physical support homes, this reliability can mean the difference between safety and disaster.
The Role of UPS Systems in NDIS Homes
Power disruptions are more than just inconveniences in NDIS high physical support homes; they can lead to equipment failure, data loss, and even compromise the safety and well-being of residents. Critical devices such as ventilators, communication systems, and monitoring equipment require a continuous power supply to function properly. Any interruption can have severe consequences.
UPS systems provide a reliable and immediate solution to these challenges. They act as a safety net, kicking in the moment a power disruption occurs, ensuring that all essential devices and systems remain operational. This uninterrupted power supply is crucial for maintaining the standard of care and support that NDIS high physical support homes promise to their residents.
Key Benefits of UPS Battery Backup for NDIS Homes
Continuous Power Supply: UPS systems ensure that there is no gap in power supply, keeping essential medical and operational equipment running seamlessly.
Protection Against Power Surges: They safeguard sensitive equipment from power surges and spikes, which can cause damage and result in expensive repairs or replacements.
Enhanced Safety: With UPS systems in place, safety devices like emergency lighting, alarms, and security cameras remain functional during power outages, providing a secure environment for residents and staff.
Handling Induction Loads: PSS UPS systems are designed to handle induction loads, making them ideal for equipment such as emergency doors and other inductive devices that are critical in NDIS high physical support homes.
Why Invest in a UPS System for NDIS High Physical Support Homes?
Reliability: A UPS system guarantees that power interruptions do not affect the reliability of the care provided. This is particularly vital in homes where residents depend on life-sustaining equipment.
Cost Efficiency: By preventing damage to expensive medical equipment and avoiding data loss, UPS systems can save NDIS homes significant costs related to repairs, replacements, and downtime.
Peace of Mind: Families and staff can rest assured that the facility is well-prepared for power outages, ensuring that the residents’ well-being is never compromised.
Regulatory Compliance: Implementing UPS systems helps NDIS homes meet stringent regulatory standards, demonstrating their commitment to providing safe and reliable care.
Choosing the Right UPS System with PSS Distributors
At PSS Distributors, we specialize in providing high-quality UPS solutions tailored to the needs of NDIS high physical support homes. With over 30 years of experience and a deep understanding of the unique requirements of these facilities, we offer a range of UPS systems designed for maximum reliability and efficiency.
Our team of experts is ready to help you select and install the right UPS system to ensure continuous power supply and protection for your residents and equipment. We provide comprehensive support from consultation to installation and maintenance, ensuring that your UPS system performs optimally.
Conclusion
In NDIS high physical support homes, ensuring a reliable power supply is a critical aspect of providing safe and effective care. A UPS battery backup system from PSS Distributors offers the peace of mind, reliability, and protection needed to keep these homes running smoothly, even during power disruptions. Learn more about our UPS solutions for NDIS homes and contact us for a consultation when building a NDIS home.
In today’s world, environmental sustainability isn’t just a buzzword—it’s a responsibility that businesses must embrace. At PSS, we take this responsibility seriously, striving to minimize our environmental footprint at every opportunity. Here’s how we’re making a difference:
Transitioning to Eco-Friendly Packaging
We’re constantly striving to improve our environmental practices, which is why we’re excited to announce our transition to eco-friendly boxes. Our new packaging features cardboard materials instead of glossy plastics, reducing waste and making it easier for customers to recycle. It’s a small change with a big impact—one that reflects our ongoing commitment to sustainability. Below is how we are managing this with our various brands:
UPS Packaging
One of the first steps we’ve taken is to rethink our packaging materials. Our UPS units now come with minimal to no plastic packaging. By minimising plastic usage, we’re not only reducing waste but also lessening our dependence on non-biodegradable materials. It’s a small change that makes a big difference.
Foam-Free Racks
In addition to reducing plastic, we’re also committed to eliminating unnecessary packaging materials. The majority of our racks now come with foam-free packaging, ensuring that we’re not contributing to the proliferation of foam waste. It’s a small change that aligns with our larger sustainability goals.
Patriot Power Supplies by PSS Distributors
is also making strides in sustainable packaging. We’re proud to announce that most Patriot power supplies are now shipped in recyclable packaging, and we are committed to transitioning the remaining products to fully recyclable packaging by the end of 2025. This initiative underscores our dedication to reducing environmental impact across all brands.
All UPS, Redback racks and patriot power supplies that have already moved towards fully recyclable packaging come labeled to assist all staff in making he right choices when disposing of packaging
Battery and Cable Recycling
At PSS, we believe in taking responsibility for our products throughout their lifecycle. That’s why we offer battery and cable recycling services to our customers. By facilitating the proper disposal and recycling of these items, we’re helping to divert hazardous materials from landfills and promote the reuse of valuable resources.
Cardboard Recycling Across Warehouses
last but not least, sustainability isn’t just about the products we sell—it’s also about how we operate as a company. That’s why we’ve implemented cardboard recycling programs across all our warehouses. By recycling cardboard packaging materials, we’re reducing waste and conserving valuable resources, all while setting an example for responsible corporate citizenship.
At PSS, environmental consciousness isn’t just a trend—it’s a core value that guides everything we do. From reducing plastic waste to promoting recycling initiatives, we’re committed to making a positive impact on the planet. Join us in our journey toward a more sustainable future. Together, we can make a difference.
What are you doing to lead the way in Environmental Responsibility?