NSW’s 10 Power Outage Blackspots Revealed

Introduction

In today’s increasingly connected world, even a brief power outage can disrupt businesses, compromise safety, and inconvenience thousands of residents. With New South Wales experiencing frequent and widespread outages, identifying the areas most impacted is critical for planning and resilience.

This report, NSW’s 10 Power Outage Blackspots Revealed, examines April 2023–March 2024 power outage data from AusGrid, the leading energy distributor in NSW, to uncover the regions most affected by power disruptions. By analysing outage trends and their implications, alongside 2023 demographic data from the Australian Bureau of Statistics, we provide a detailed overview of how these interruptions impact communities and businesses across the state.

From emergency preparedness to long-term power solutions, we highlight practical approaches to safeguard against outages, including the use of Uninterruptible Power Supply (UPS) systems as a reliable option. Whether you’re a homeowner or business owner, this analysis will help you take proactive steps to mitigate the risks of power interruptions in today’s energy landscape.

Outage Trends and Implications

This is a tabulation of the data from AusGrid and the Australian Bureau of Statistics.

LGA (Local Government Area)Number of Power OutagesTotal Customers InterruptedTotal Number of Residents in the LGATotal Number of Businesses in the LGA% of Residents Owning a Business in the LGA% of Customers Affected (Residential or Commercial)Total Businesses Interrupted
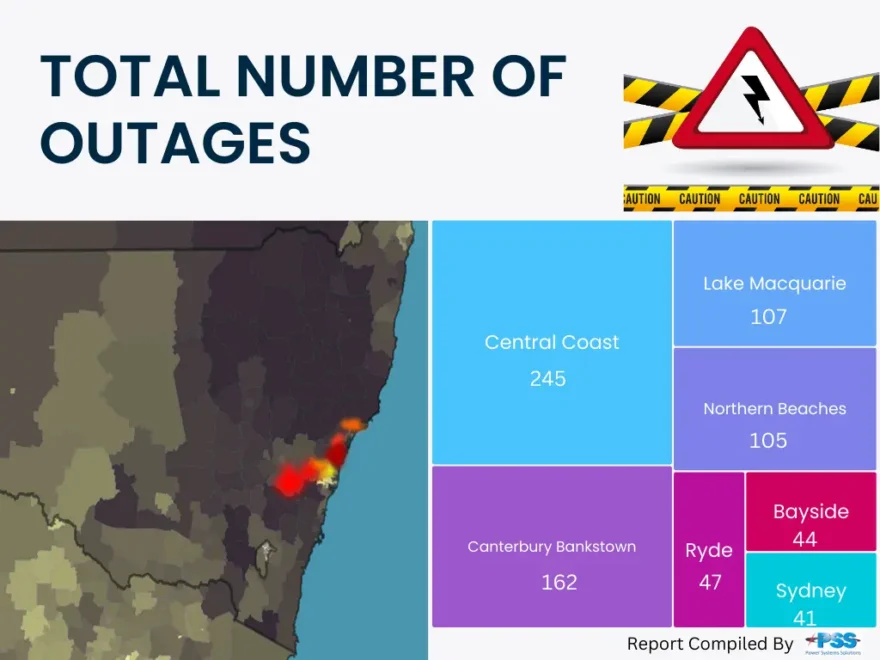
Central Coast245184631351934262667.46%52.46%13780
Canterbury Bankstown162791713798294110210.82%20.84%8567
Northern Beaches105572732679213290512.28%21.38%7034
Sydney41174192310867916334.26%7.54%5967
Lake Macquarie10789410219249142766.51%40.78%5822
Hornsby9260278154072141119.16%39.12%5521
Sutherland8540409235029227529.68%17.19%3912
Ryde47354381357161436110.58%26.11%3750
Ku-ring-gai55285621269831492011.75%22.49%3356
Bayside44316641829871884310.30%17.30%3261

Power Outages and Customers Interrupted


From the data on power outages and customers interrupted across Local Government Areas (LGAs), we can infer the following trends:

High Outage Areas vs. Customer Impact

  • Central Coast has the highest number of power outages (245) and the largest number of customers interrupted (184,631). This suggests either a more vulnerable power infrastructure or greater exposure to factors causing outages, such as weather or demand.
  • Conversely, Sydney, despite being a major urban area, has relatively fewer outages (41) and fewer customers affected (17,419). This could indicate better infrastructure or fewer disruptions relative to its population.

Outages and Population Correlation

  • LGAs like Canterbury Bankstown and Lake Macquarie have similar outage counts (162 and 107, respectively), but the total customers interrupted are vastly different (79,171 vs. 89,410). This suggests variability in the density of customers affected by each outage.
  • Ryde and Ku-ring-gai, with lower outage numbers (47 and 55), still have moderate customer interruptions (35,438 and 28,562), indicating smaller but denser affected populations.

Northern Beaches vs. Hornsby

  • Both LGAs show a similar pattern in terms of the number of customers interrupted (57,273 and 60,278), despite differing numbers of outages (105 vs. 92). This suggests similar population densities or areas served by shared infrastructure.

Efficiency of Response or Network Robustness

  • LGAs with a lower ratio of outages to customers (e.g., Sydney, Bayside) might have more robust or better-maintained power networks, minimising the scale of interruptions despite outages occurring.

Urban vs. Suburban Impact

  • Denser urban areas such as Sydney and Bayside experience fewer outages and relatively fewer customers interrupted, possibly reflecting stronger, well-maintained infrastructure compared to more suburban or regional areas like the Central Coast and Lake Macquarie.

Disparity in Outage Scale

  • The Central Coast demonstrates a much larger scale of impact, with significantly more customers per outage compared to others like Ku-ring-gai or Ryde. This suggests variability in the geographic scope and intensity of each outage.

These trends could guide decisions on where to invest in infrastructure improvements, particularly focusing on areas with high outage counts and large customer impacts, such as the Central Coast and Lake Macquarie.

Relationship Between Power Outages, Customer Interruptions, and Population Size

With the addition of total resident numbers in each LGA, we can draw more nuanced insights about the relationship between power outages, customer interruptions, and population size:

Outage Density vs. Population Size

  • Central Coast has a high number of power outages (245) and the largest number of customers interrupted (184,631), accounting for 52.4% of its population. This suggests that outages in this area affect a significant portion of the population, potentially due to high dependency on the grid and less resilient infrastructure.
  • Canterbury Bankstown, despite being the most populous LGA (379,829), has a comparatively smaller percentage of residents impacted by outages (20.8% of the population). This may indicate better grid management or infrastructure to limit the scale of interruptions.

Impact Proportionate to Population

  • Northern Beaches and Ku-ring-gai show interesting contrasts:
    • Northern Beaches has 21.4% of residents interrupted, with 105 outages for 267,921 people.
    • Ku-ring-gai has fewer outages (55) and impacts 22.5% of its population. This may suggest that while outages are less frequent, they affect a larger proportion of the population in Ku-ring-gai.

Disparities in Grid Resilience

  • Sydney LGA, despite being urban and densely populated (231,086), has the lowest proportion of affected residents (7.5%). This likely reflects robust infrastructure and effective outage management in a high-priority area.
  • Ryde and Bayside both show moderate outage numbers (47 and 44) and affected residents (35,438 and 31,664), representing 26.1% and 17.3% of their populations, respectively.

Disproportionate Customer Impact

  • Lake Macquarie stands out with 40.8% of its population impacted by outages, despite having fewer residents than the Central Coast. This suggests a greater reliance on grid power in this semi-urban area, or possibly larger outage footprints affecting more customers per event.

Smaller LGAs with Higher Impact

  • Hornsby and Sutherland, despite smaller populations (154,072 and 235,029), have notable proportions of affected residents (39.1% and 17.2%, respectively). Hornsby’s data may indicate areas with concentrated outages or infrastructure challenges.

Key Patterns to Emphasise

  • Larger LGAs like Canterbury Bankstown and Sydney seem better equipped to mitigate the effects of outages on their populations.
  • Areas like Lake Macquarie, Central Coast, and Hornsby show the highest vulnerability, with large proportions of residents affected relative to their total populations.
  • Urban LGAs like Sydney and Bayside show the lowest disruption levels, likely due to prioritised grid infrastructure and outage response systems.

These trends provide compelling evidence for the need to invest in UPS systems, especially in high-impact areas like the Central Coast, Lake Macquarie, and Hornsby, where frequent and widespread outages are likely to cause significant disruptions.

Impact of Power Outages on Local Economies and Business Operations

Adding the number of businesses in each LGA to the analysis provides additional insights into how power outages might affect local economies and business operations. Here are the key trends and observations:

Business Impact Relative to Outages

  • Sydney LGA has the fewest outages (41) but the highest number of businesses (79,163). Only 21.99% of businesses are impacted, suggesting a relatively robust power infrastructure that minimises business disruptions despite its economic significance as a major business hub.
  • Central Coast, with 245 outages and 26,266 businesses, shows a stark contrast: 70.3% of businesses are potentially affected. This high proportion underscores the vulnerability of businesses in this region to frequent outages.

Smaller Business Regions, High Customer Impact

  • Lake Macquarie has 107 outages and only 14,276 businesses, with 626.5 customers interrupted per business on average. This indicates that outages in this area disproportionately affect residents and business operations, which may rely heavily on continuous power.
  • Hornsby and Ku-ring-gai, with similar numbers of businesses (~14,000), show contrasting customer impact:
    • Hornsby: 60278 total customers interrupted → 4.3 customers impacted per business.
    • Ku-ring-gai: 28,562 total customers interrupted → 1.9 customers impacted per business. This suggests businesses in Hornsby may experience more operational challenges during outages.

Business Density in High-Outage Areas

  • Northern Beaches, with 105 outages and 32,905 businesses, shows a relatively moderate proportion of businesses affected (28.4%). However, its business density suggests the economic impact of outages may still be significant for local businesses that depend on a steady power supply.
  • Canterbury Bankstown, with 162 outages and 41,102 businesses, has 19.2% of businesses interrupted. This indicates better outage management or distributed impacts in this populous area.

Regional Disparities in Business Vulnerability

  • Smaller, business-focused LGAs like Ryde and Bayside show different dynamics:
    • Ryde: 47 outages and 14,361 businesses result in 2.46 customers interrupted per business.
    • Bayside: 44 outages and 18,843 businesses result in 1.68 customers interrupted per business. This implies that businesses in Bayside are less likely to face extended disruptions compared to those in Ryde, even with a similar number of outages.

Large-Scale Business Hubs

  • Sydney, with a high number of businesses, benefits from lower outages and customer interruptions, demonstrating its priority as a central hub for economic activity. This highlights the importance of reliable grid management in high-density business regions.

Key Outage-to-Business Ratios

  • Central Coast and Lake Macquarie show the highest outages per business ratios (0.0093 and 0.0075 outages per business, respectively). This reflects a strong need for backup systems, especially given the reliance on power-dependent industries in these regions.

Implications for UPS Adoption

  • LGAs like the Central Coast, Lake Macquarie, and Northern Beaches demonstrate the highest need for UPS systems, as frequent outages disrupt both businesses and large customer bases.
  • Sydney and Canterbury Bankstown, while benefiting from more reliable power infrastructure, could still explore UPS systems for critical operations, especially given their large business populations.

Business Ownership and Outage Impact

  • Sydney LGA stands out with 34.26% of residents owning businesses, significantly higher than other LGAs. However, the percentage of customers affected is the lowest (7.54%), and the total number of interrupted businesses is moderate (5,967). This reflects Sydney’s robust infrastructure despite its high concentration of businesses.
  • Northern Beaches has the second-highest rate of business ownership (12.28%), but only 21.38% of customers are affected, suggesting better mitigation of outages for both residents and businesses.

High Outage Density in Less Business-Dense Areas

  • Central Coast has the highest number of customers affected (184,631) and total businesses interrupted (13,780), despite having a relatively low business ownership rate (7.46%). This suggests outages are more widespread and indiscriminate, affecting both residential and commercial sectors significantly.
  • Lake Macquarie follows a similar pattern with 40.78% of customers affected, indicating high vulnerability in regions with lower business density (6.51% business ownership rate).

Customer Impact Proportionality

  • Canterbury Bankstown, while being the most populous LGA (379,829 residents), has a low 20.84% of customers affected. This indicates better grid resilience or more targeted infrastructure improvements.
  • Ku-ring-gai and Ryde, with mid-range populations and business ownership rates (11.75% and 10.58%, respectively), show moderate customer impacts (22.49% and 26.11%).

Residential vs. Business Impact

  • The Central Coast, Lake Macquarie, and Hornsby stand out as areas where businesses are disproportionately affected relative to their ownership rates. These LGAs likely experience outages that have broad impacts on both sectors, but businesses may struggle more to recover due to smaller economies of scale.
  • Urban LGAs like Sydney and Bayside have fewer outages and lower percentages of affected customers, reflecting stronger grid resilience for high-density populations.

Regional Disparities in Outage Severity

  • Rural and semi-urban LGAs such as the Central Coast and Lake Macquarie show:
    • Higher percentages of total customers affected (52.46% and 40.78%, respectively).
    • Significant disruption to businesses (13,780 and 5,822 businesses interrupted). These areas may benefit most from the implementation of UPS systems to safeguard against recurring outages.
  • Urban hubs like Sydney and Canterbury Bankstown have fewer businesses interrupted and lower customer impact rates, reflecting prioritised infrastructure in metropolitan regions.

Business Risk in Mid-Range LGAs

  • LGAs such as Hornsby, Ryde, and Ku-ring-gai experience moderate customer impact percentages (22.49%–39.12%) and significant business interruptions (3,356–5,521). These areas may not have the extensive infrastructure of urban hubs, making businesses more vulnerable to even short outages.

Key Takeaways

  • High-Risk LGAs: The Central Coast, Lake Macquarie, and Hornsby require urgent attention to address frequent outages impacting large proportions of residents and businesses.
  • Mid-Risk LGAs: Ryde and Ku-ring-gai demonstrate growing business risks despite moderate outage levels, suggesting these areas could benefit from targeted UPS solutions.
  • Low-Risk LGAs: Urban centres like Sydney and Bayside show resilience due to lower customer impact rates and fewer business interruptions, reflecting strong grid management.

Geographical Analysis

When incorporating the geographical locations of these LGAs into the analysis, several trends and insights emerge, reflecting how geography influences power outages, customer impacts, and business interruptions.

Urban vs. Regional Disparities

  • Urban LGAs (Sydney, Bayside, Canterbury Bankstown):
    • These areas, located closer to the Sydney CBD, experience fewer power outages (e.g., Sydney with 41 outages and Bayside with 44). Urban infrastructure is often more robust, prioritised for maintenance, and equipped with robust systems.
    • They also show lower percentages of customers affected (e.g., 7.54% in Sydney, 17.30% in Bayside) due to a dense but resilient grid.
    • Urban LGAs typically host a higher concentration of businesses, with Sydney LGA alone having 79,163 businesses, suggesting an economic prioritisation in maintaining power reliability.
  • Regional and Semi-Urban LGAs (Central Coast, Lake Macquarie, Hornsby):
    • These LGAs, geographically further from the CBD and more rural or suburban in character, face frequent outages and higher percentages of customers affected (e.g., 52.46% in Central Coast and 40.78% in Lake Macquarie). This indicates less resilient infrastructure in areas further from metropolitan hubs.
    • Businesses in these areas are more vulnerable, with a higher percentage impacted, such as 13,780 interrupted businesses in Central Coast, reflecting the widespread nature of outages.

Coastal vs. Inland Vulnerabilities

  • Coastal LGAs (Central Coast, Northern Beaches, Lake Macquarie):
    • Coastal areas are more exposed to weather-related risks, such as storms and salt-related equipment degradation, which can lead to higher outage numbers (e.g., 245 outages in Central Coast).
    • Northern Beaches, while coastal, shows fewer customers affected (21.38%) compared to the Central Coast, likely due to better-maintained infrastructure.

Inland LGAs (Hornsby, Ryde, Ku-ring-gai):

  • While inland, these LGAs still show significant impacts due to outages. For instance:
    • Hornsby has 39.12% of customers affected, highlighting that even suburban areas face infrastructure challenges.
    • Ku-ring-gai shows lower impact proportions (22.49%) but still experiences notable business interruptions.

Business Density and Impact

  • High-Density Business Hubs (Sydney, Canterbury Bankstown, Northern Beaches):
    • These areas have a high percentage of residents owning businesses (e.g., 34.26% in Sydney, 12.28% in Northern Beaches) and experience fewer interruptions, showcasing the benefit of centralised and prioritised infrastructure for commercial centres.
  • Low-Density Business Regions (Lake Macquarie, Hornsby):
    • Businesses here are fewer in number (e.g., 14,276 in Lake Macquarie), but outages disproportionately affect operations. This suggests a higher need for UPS solutions in these regions to ensure business continuity.

Residential Impacts Across Regions

  • Higher Residential Risk in Regional LGAs:
    • Central Coast has over half its population impacted by outages (52.46%), highlighting significant residential vulnerability.
    • Lake Macquarie and Hornsby follow with 40.78% and 39.12%, respectively, suggesting that infrastructure in these LGAs struggles to keep pace with demand or environmental challenges.
  • Lower Residential Risk in Urban LGAs:
    • Sydney and Bayside, located near the urban core, demonstrate the lowest residential impacts (7.54% and 17.30%, respectively), reflecting stronger infrastructure maintenance and redundancy.

Proximity to Economic Centres

  • LGAs closer to economic centres like Sydney CBD (e.g., Bayside, Ryde, Canterbury Bankstown) show fewer outages and lower overall customer impact percentages. This highlights the economic prioritisation of these areas, where maintaining power reliability is critical for business and government functions.
  • Peripheral LGAs (e.g., Central Coast, Lake Macquarie) face more significant challenges due to their distance from centralised energy infrastructure and potential delays in outage resolution.

Geographical Insights

  • Urban Core Advantage: LGAs within or near Sydney’s urban core benefit from prioritised infrastructure investment, leading to fewer outages and lower impact rates. Businesses in these areas are less likely to face extended disruptions.
  • Coastal Risks: Coastal LGAs experience more outages and greater customer impacts, likely due to environmental factors like storms and salt exposure. This is particularly evident in the Central Coast and Lake Macquarie.
  • Suburban and Regional Struggles: LGAs further from the city centre, especially in semi-urban or regional areas like Hornsby, face significant infrastructure challenges, leading to high percentages of affected customers and businesses.

Coastal, suburban, and regional areas are at greater risk, underscoring the importance of UPS systems in these locations to safeguard residential comfort and business continuity. Urban areas, while more resilient, can still benefit from backup power solutions to protect critical infrastructure and operations.

Quarterly Analysis

Causes of Power Outages in NSW LGAs between April 2023 and March 2024
CauseNumber
Environmental707
Equipment fault796
Third party128
Operating fault19
Vandalism9
Cable dig20
Lightning30
Customer installation6

January 2024 to March 2024

Causes of Power Outages in NSW LGAs between January 2024 and March 2024
CauseNumber
Environmental242
Equipment fault226
Third party32
Operating fault4
Vandalism4
Cable dig9
Lightning7
Customer installation1

Several trends emerge regarding power outages between January and March 2024. Here’s a summary of the trends:

Primary Causes of Outages

  • Equipment Faults: A significant portion of outages in all areas is due to equipment faults. These faults often result in longer average outage durations, especially in areas like Hornsby, Ku-ring-gai, and Ryde.
  • Environmental Factors: Environmental causes (storms, high winds, heat) are prevalent, particularly in Northern Beaches, Lake Macquarie, and Sutherland, which are geographically exposed to natural elements. These outages often coincide with extreme weather events and have varying durations.
  • Third-Party and Cable Digs: Urban areas like Sydney, Ryde, and Canterbury Bankstown show higher instances of third-party interference (e.g., cable digs), reflecting construction and urban development activity.
  • Lightning: Seen in areas like Lake Macquarie and Ku-ring-gai, lightning contributed to outages with moderately long durations.

Seasonal Trends

  • January: Environmental causes dominated this month, particularly in areas prone to severe weather, such as Lake Macquarie and Hornsby. Equipment faults were also frequent in urban regions like Canterbury Bankstown and Ryde.
  • February: Outages caused by lightning and environmental factors spiked, particularly in Lake Macquarie, Ku-ring-gai, and Northern Beaches, coinciding with summer thunderstorms. Urban areas also saw construction-related outages.
  • March: Equipment faults became more prominent in almost all areas, suggesting increased stress on aging infrastructure post-summer. Environmental factors, while still present, showed a decline compared to earlier months.
Power Outages Caused by Environmental Factors in NSW LGAs
QuarterNumber of Outages
January 2024 to March 2024242
October 2023 to December 2023262
July 2023 to September 2023108
April 2023 to June 202395

Timing and Frequency

  • Outages in residential areas (e.g., Hornsby, Ku-ring-gai, Northern Beaches) tend to occur in the early morning or late afternoon, possibly due to increased load during these times.
  • Urban areas like Sydney and Ryde see more outages during standard working hours (e.g., 9 AM–5 PM), likely related to construction or equipment faults during active infrastructure operations.
  • Some rural and suburban areas, such as Lake Macquarie, experienced sporadic outages late at night or early morning, typically linked to environmental causes.

Duration of Outages

  • Prolonged Outages: Notable in areas like Hornsby, Ku-ring-gai, and Ryde, where equipment failures caused outages lasting several hours (e.g., over 200 minutes in some cases).
  • Shorter Outages: Urban areas (e.g., Sydney, Bayside) generally saw shorter outages, often resolved within 50–100 minutes, potentially reflecting faster repair times due to better resources and proximity to repair teams.
  • Environmental Causes: Outages caused by storms or lightning often had moderate-to-long durations, as seen in Lake Macquarie, Northern Beaches, and Sutherland, likely due to safety protocols and complex repairs.
Power Outages Caused by Equipment Faults in NSW LGAs
QuarterNumber of Outages
January 2024 to March 2024226
October 2023 to December 2023244
July 2023 to September 2023141
April 2023 to June 2023185

Location-Specific Insights

  • Central Coast and Lake Macquarie: These regions experienced frequent outages due to environmental factors, particularly during summer storms. Equipment faults were also common, reflecting aging infrastructure in some parts.
  • Canterbury Bankstown: A mix of causes was observed, with a notable contribution from equipment faults and third-party issues. Outages were generally shorter here.
  • Northern Beaches: Environmental factors like storms dominated, with occasional equipment faults.
  • Sydney and Bayside: Urban development and third-party interference (cable digs) were the leading causes. Outages here were typically shorter due to efficient restoration.
  • Hornsby and Ku-ring-gai: These areas faced a mix of environmental and equipment-related outages, often lasting longer than in other regions.
  • Ryde: Frequent outages were caused by equipment faults, with some of the longest durations recorded.
  • Sutherland: Equipment faults were the primary issue, followed by environmental factors. Outages here were relatively moderate in duration.

Key Observations

  • Infrastructure Challenges: Equipment faults are a recurring issue, highlighting aging infrastructure across most areas, particularly in Hornsby, Ku-ring-gai, and Ryde.
  • Environmental Vulnerability: Areas exposed to natural elements, such as Lake Macquarie, Sutherland, and Northern Beaches, are more prone to weather-related outages, particularly in summer months.
  • Urban Impact: Urban areas like Sydney, Canterbury Bankstown, and Ryde show a higher frequency of outages caused by third-party activities, reflecting construction activity and population density.

October 2023 to December 2023

Causes of Power Outages in NSW LGAs between October 2023 and December 2023
CauseNumber
Environmental262
Equipment fault244
Third party30
Operating fault2
Vandalism3
Cable dig4
Lightning20
Customer installation4

The following are the trends and insights related to power outages in the areas concerned for October to December 2023:

Seasonal Patterns

  • Environmental Causes: Environmental reasons, including storms, heat, and lightning, were more prevalent as causes in December, suggesting a seasonal impact. This aligns with Australia’s summer season, where extreme weather events like thunderstorms and high winds are common.
  • Equipment Faults: Equipment failures were consistent throughout the months but showed a slight uptick in December, possibly due to increased load on infrastructure during the holiday season.

Timing of Outages

  • Late Evenings and Early Mornings: A noticeable pattern is the high frequency of outages occurring late at night (10 PM–2 AM) and early morning hours (5 AM–7 AM). This could be attributed to routine maintenance or less immediate attention to faults during non-peak hours.
  • Afternoons (2 PM–4 PM): Afternoon outages are also frequent, particularly in high-demand areas, possibly due to increased energy usage during hot afternoons.
Power Outages Caused by Third-Party Activities in NSW LGAs
QuarterNumber of Outages
January 2024 to March 202432
October 2023 to December 202330
July 2023 to September 202325
April 2023 to June 202341

Regional Trends

Central Coast (Gosford, Wyong, Lake Macquarie, Newcastle)

  • Frequent Environmental Causes: This region frequently reported environmental causes, including storms and lightning, especially in Lake Macquarie and Wyong.
  • Long Durations: Some of the longest outages (e.g., 1,000+ minutes in Wyong) occurred here, likely due to the combination of environmental challenges and infrastructure strain.

Canterbury Bankstown (Bankstown, Canterbury)

  • Consistent Equipment Faults: Equipment failure was the primary cause of outages, with additional cases of lightning and environmental issues during December.
  • Shorter Outages: The average duration of outages in this region tended to be shorter compared to Central Coast.

Northern Beaches (Warringah, Pittwater, Manly)

  • Equipment Faults and Environmental Factors: Equipment faults dominated, with environmental factors like storms becoming more frequent in December.
  • High Customer Impact: Warringah and Manly had several outages impacting large customer bases (e.g., 2,000+ customers), indicating this area’s high sensitivity to outages.

Sydney (Sydney CBD, South Sydney, Inner West)

  • Third-Party Causes: Sydney experienced a noticeable share of outages caused by third-party activities (e.g., cable digs). These disruptions are common in densely populated areas with ongoing infrastructure projects.
  • Shorter Durations: Outages in Sydney were typically resolved faster, likely due to better infrastructure and quicker response times.

Lake Macquarie

  • Environmental Dominance: Most outages were attributed to environmental causes, with extended durations (e.g., 441 minutes on 29 November). This highlights the region’s susceptibility to natural events like storms.

Hornsby

  • Equipment Faults and Environmental Causes: Hornsby displayed a balance between equipment faults and environmental causes. The area experienced several significant outages affecting large numbers of customers.

Sutherland

  • Environmental Factors Lead: Environmental issues caused most outages, though equipment faults also appeared consistently.
  • Higher Outage Counts: Sutherland recorded frequent outages across all months, making it one of the more outage-prone regions.

Ryde

  • Short Durations: Outages in Ryde generally had shorter durations compared to other areas.
  • Equipment Failures: Equipment faults were the leading cause, reflecting potential infrastructure challenges in this region.

Ku-ring-gai

  • Balanced Causes: Equipment faults and environmental issues were both significant. The area occasionally experienced longer outage durations, suggesting repair challenges.
  • Spike in December: December saw an increase in outage frequency, likely due to summer weather conditions.

Bayside (Rockdale, Botany, Waverley, Woollahra)

  • Short but Frequent Outages: Bayside areas experienced shorter outages overall but had consistent frequency across the months.
  • Diverse Causes: Outages here were attributed to equipment faults, third-party activities, and lightning.


Power Outages Caused by Operating Faults in NSW LGAs
QuarterNumber of Outages
January 2024 to March 20244
October 2023 to December 20232
July 2023 to September 202310
April 2023 to June 20233

Causes of Outages

  • Equipment Faults: These were the most consistent cause of outages across all areas. This trend suggests potential aging infrastructure or insufficient capacity for peak loads.
  • Environmental Factors: These surged in December, aligning with Australia’s summer storm season. Areas like Lake Macquarie, Wyong, and Sutherland were heavily affected.
  • Third-Party Issues: Inner Sydney and Bayside areas saw more outages caused by third-party activities like cable digs, reflecting ongoing urban development and construction projects.

Customer Impact

  • High Impact Areas: Regions like Warringah, Bankstown, and Gosford saw outages affecting thousands of customers in several instances, indicating higher population density or more extensive infrastructure networks.
  • Shorter Durations in Urban Areas: Central Sydney, Bayside, and parts of Ryde experienced quicker resolutions, likely due to proximity to repair teams and better infrastructure.

Overall Observations

  • Summer Challenges: December saw a marked increase in outages due to environmental factors, highlighting the need for improved weather-resilient infrastructure in areas like Central Coast, Northern Beaches, and Sutherland.
  • Aging Equipment: Equipment faults remain a major concern across all regions, necessitating upgrades or proactive maintenance programs.
  • Third-Party Disruptions: Urban areas like Sydney and Bayside are prone to outages from third-party activities, reflecting the challenges of managing power networks in densely populated regions.

July 2023 to September 2023

Causes of Power Outages in NSW LGAs between July 2023 and September 2023
CauseNumber
Environmental108
Equipment fault141
Third party25
Operating fault10
Vandalism1
Cable dig3
Lightning1
Customer installation0

Here’s an analysis of the power outage data for the areas of concern from July to September 2023:

General Trends

  1. Frequency of Outages:
    1. Central Coast (Gosford, Wyong, Newcastle): Consistently experienced frequent outages, often multiple events per day in some cases.
    2. Canterbury Bankstown: Fewer outages than Central Coast but significant ones, often with high average durations.
    3. Northern Beaches (Manly, Pittwater, Warringah): Moderate number of outages, with notable durations in some cases.
    4. Sydney (Central and South Sydney): Sporadic outages, some with a high number of customers interrupted.
    5. Lake Macquarie: Frequent outages with considerable duration in some cases.
    6. Hornsby: Regular outages with a mix of equipment faults and environmental causes.
    7. Sutherland: Frequent outages, some affecting thousands of customers, with a variety of causes.
    8. Ryde: Few outages, but some with high customer impacts.
    9. Ku-ring-gai: Moderate outages, often caused by environmental factors.
    10. Bayside (Rockdale, Botany, Randwick): Regular outages, particularly in Randwick, with durations often exceeding 100 minutes.
  2. Common Causes:
    1. Equipment Faults: The dominant cause across all areas. This indicates aging infrastructure or the inability to handle peak loads during winter.
    2. Environmental: Second most frequent cause, likely related to seasonal weather patterns (rain, storms, winds).
    3. Third Party: Less frequent but noticeable, particularly in urban areas like Sydney and Ryde.
    4. Operating Faults: Rare but impactful when they occur.
    5. Lightning: A specific cause for some outages in late September, likely seasonal.
  3. Seasonal Impact:
    1. Winter months (July to September) coincide with increased load due to heating and weather-related stresses on infrastructure.
    2. September shows an uptick in environmental causes (e.g., storms, lightning), particularly in Central Coast and Lake Macquarie.
  4. Average Duration:
    1. Some areas, like Lake Macquarie, Canterbury Bankstown, and Sutherland, experienced prolonged outages (200+ minutes on average).
    2. Shorter durations were observed in areas with higher population density, possibly due to faster response times (e.g., Sydney, Ryde).
Power Outages Caused by Vandalism in NSW LGAs
QuarterNumber of Outages
January 2024 to March 20244
October 2023 to December 20233
July 2023 to September 20231
April 2023 to June 20231

Area-Specific Trends

Central Coast (Gosford, Wyong, Newcastle)

  • High frequency of outages, especially in Gosford and Wyong.
  • Equipment faults dominate, but environmental causes also feature significantly.
  • Longer durations compared to urban areas, possibly due to distance from response teams.

Canterbury Bankstown

  • Moderate frequency of outages, often equipment-related.
  • High average durations indicate challenges in resolution efficiency.

Northern Beaches (Manly, Pittwater, Warringah)

  • Moderate outages, mostly equipment faults and environmental issues.
  • Noticeable long-duration outages, especially in Pittwater and Warringah.

Sydney (South Sydney, Central Sydney)

  • Sporadic outages with mixed causes (equipment faults, third party, cable digs).
  • Shorter durations compared to regional areas.

Lake Macquarie

  • Frequent outages with long durations.
  • Equipment faults are the most common cause, but environmental factors are prominent.

Hornsby

  • Frequent outages with a balanced mix of equipment faults and environmental causes.
  • Average durations are on the higher side, reflecting response challenges.

Sutherland

  • Frequent outages with significant customer impact.
  • Equipment faults dominate, followed by environmental causes.

Ryde

  • Fewer outages but impactful when they occur.
  • Notable equipment faults and some third-party causes.

Ku-ring-gai

  • Moderate outages, often due to environmental causes.
  • Generally shorter durations compared to rural areas.

Bayside (Rockdale, Botany, Randwick)

  • Consistent outages, with Randwick experiencing the most frequent interruptions.
  • Equipment faults dominate, with occasional third-party and environmental factors.
Power Outages Caused by Cable Digs in NSW LGAs
QuarterNumber of Outages
January 2024 to March 20249
October 2023 to December 20234
July 2023 to September 20233
April 2023 to June 20234

Inferences and Observations

  1. Equipment Faults:
    1. A systemic issue across all areas, suggesting infrastructure needs upgrading or maintenance.
    2. Central Coast, Lake Macquarie, and Hornsby seem particularly affected.
  2. Environmental Factors:
    1. Seasonally significant, with spikes during periods of adverse weather (August and September).
    2. Lake Macquarie, Northern Beaches, and Bayside areas are particularly susceptible.
  3. Third-Party and Cable Digs:
    1. Noticeable in urban centres like Sydney and Ryde, indicating construction or human error.
  4. Winter Seasonality:
    1. Increased outages due to heating-related load and seasonal storms.
    2. September appears worse than July and August, possibly due to spring storm activity.
  5. Customer Impact:
    1. Larger outages in urban areas (e.g., Sydney, Ryde, Sutherland) highlight the scale of impact in densely populated areas.
    2. Regional areas (e.g., Central Coast, Lake Macquarie) face longer durations due to logistical challenges.

April 2023 to June 2023

Causes of Power Outages in NSW LGAs between April 2023 and June 2023
CauseNumber
Environmental95
Equipment fault185
Third party41
Operating fault3
Vandalism1
Cable dig4
Lightning2
Customer installation1

This data highlights trends in power outages across the identified areas between April 2023 and June 2023. Here’s an analysis based on the regions and the causes, timing, and patterns observed:

General Trends

  1. Frequency of Outages:
    1. Central Coast (Gosford, Wyong, Newcastle): High outage frequency, particularly in Gosford and Wyong. Newcastle had fewer but significant outages.
    2. Canterbury Bankstown: Moderate outage frequency, with many caused by equipment faults or third-party incidents.
    3. Northern Beaches (Manly, Pittwater, Warringah): Moderate number of outages, often linked to equipment faults or environmental factors.
    4. Sydney (South Sydney, Central Sydney): Fewer outages overall, but some had high customer impact and longer durations.
    5. Lake Macquarie: Frequent outages with long durations, a mix of equipment faults and environmental causes.
    6. Hornsby: Regular outages, primarily caused by equipment faults or environmental factors.
    7. Sutherland: High number of outages, including several large-scale incidents.
    8. Ryde: Lower frequency but high-duration outages in some cases.
    9. Ku-ring-gai: Moderate outages, a mix of environmental and equipment-related causes.
    10. Bayside (Rockdale, Botany, Randwick): Consistent outages, particularly in Randwick and Botany, with notable durations.
  2. Common Causes:
    1. Equipment Faults: The primary cause across all areas, indicating ongoing issues with aging infrastructure or maintenance.
    2. Environmental: A significant number of outages, likely linked to autumn and early winter weather (e.g., rain, storms, strong winds).
    3. Third-Party Incidents: Notable, particularly in urban areas like Sydney, Ryde, and Canterbury Bankstown, often due to construction or excavation activities.
    4. Cable Digging: A smaller but impactful cause, particularly in urban centres.
  3. Seasonal Impacts:
    1. Autumn Weather: The transition from autumn to winter (April to June) shows an increase in outages caused by environmental factors, especially in May and June.
    2. Winter Peak: Early winter likely increases load due to heating, leading to more equipment-related failures.
  4. Outage Durations:
    1. Prolonged outages were noted in Lake Macquarie, Canterbury Bankstown, Ryde, and Ku-ring-gai, often exceeding 300 minutes.
    2. Urban areas (e.g., Sydney, Bayside) had relatively shorter durations, indicating faster response times.
Power Outages Caused by Lightning in NSW LGAs
QuarterNumber of Outages
January 2024 to March 20247
October 2023 to December 202320
July 2023 to September 20231
April 2023 to June 20232

Area-Specific Trends

Central Coast (Gosford, Wyong, Newcastle)

  • Frequent outages with high customer interruptions.
  • Causes were a mix of equipment faults and environmental factors, with a few notable third-party incidents.
  • Longer durations reflect logistical challenges in response and repair times.

Canterbury Bankstown

  • Regular outages with diverse causes, including equipment faults, environmental factors, and third-party incidents.
  • Notable long-duration outages suggest potential gaps in infrastructure maintenance.

Northern Beaches (Manly, Pittwater, Warringah)

  • Moderate outages, with equipment faults dominating.
  • Environmental factors like storms contributed to some high-impact outages.

Sydney (South Sydney, Central Sydney)

  • Fewer outages compared to other areas, but impactful incidents occurred due to equipment faults and third-party activities.
  • Urban response times seem faster, leading to shorter durations.

Lake Macquarie

  • Frequent and impactful outages, particularly in May and June.
  • Equipment faults and environmental causes dominated, with several prolonged outages.

Hornsby

  • Regular outages with notable environmental and equipment-related causes.
  • Durations were moderate, indicating effective response in most cases.

Sutherland

  • High frequency of outages, with some large-scale incidents impacting thousands of customers.
  • Equipment faults were the leading cause, followed by environmental factors.

Ryde

  • Infrequent outages but with significant customer impact when they occurred.
  • Equipment faults and third-party incidents were the primary causes.

Ku-ring-gai

  • Regular outages, often due to environmental factors like storms.
  • Moderate durations reflect manageable response efforts.

Bayside (Rockdale, Botany, Randwick)

  • Frequent outages in Randwick and Botany, with a mix of equipment faults and environmental causes.
  • Longer durations in some cases highlight the need for more robust infrastructure.
Power Outages Caused by Customer Installation in NSW LGAs
QuarterNumber of Outages
January 2024 to March 20241
October 2023 to December 20234
July 2023 to September 20230
April 2023 to June 20231

Inferences and Observations

  1. Equipment Faults:
    1. A pervasive issue across all areas, particularly in Lake Macquarie, Sutherland, and Central Coast. This indicates a systemic need for infrastructure upgrades and maintenance.
  2. Environmental Factors:
    1. Autumn and winter weather heavily impacted Northern Beaches, Lake Macquarie, and Bayside areas, reflecting vulnerability to storms and high winds.
  3. Third-Party Incidents:
    1. More common in urban areas like Sydney, Ryde, and Canterbury Bankstown, likely due to increased construction activities.
  4. Regional vs Urban Response Times:
    1. Urban areas (e.g., Sydney, Bayside) had shorter outage durations due to proximity to resources and response teams.
    2. Regional areas (e.g., Central Coast, Lake Macquarie) faced longer durations, indicating logistical challenges.
  5. Seasonality:
    1. Environmental causes peaked during the transition from autumn to winter, particularly in May and June.
    2. Equipment faults seemed consistent throughout the period but worsened slightly during colder months.

How to Handle Power Outages and Reduce Their Impact

Power outages can be a headache, whether you’re running a business or just trying to get through your day at home. From spoiled food to lost productivity, the ripple effects can be frustrating and costly. But you don’t have to be at the mercy of the grid. Here are practical ways to keep the lights on and your operations running smoothly.

1. Uninterruptible Power Supply (UPS)

When the power goes out, a UPS can step in immediately, giving you the extra time needed to save your work, shut down devices properly, or keep critical equipment like medical devices running. It’s a must-have for businesses that can’t afford even a second of downtime. Homeowners, too, can benefit by keeping Wi-Fi, fridges, and other essentials online in short outages. UPS systems come in all sizes, so you can pick one that suits your setup without overspending.

2. Backup Generators

For longer outages, a generator is the go-to solution. Portable generators can keep your basics running, while larger, fixed models can power everything from your home to a warehouse. Just remember—they need fuel and regular servicing to stay ready for action.

3. Solar Panels with Batteries

If you’re looking to reduce your reliance on the grid altogether, solar panels paired with battery storage can be a game-changer. They let you store energy for a rainy day (or a blackout) and can give you the peace of mind of having your own backup power supply. The upfront cost is high, but over time, the savings and independence can make it worthwhile, especially in areas prone to frequent outages.

4. Keep an Eye on Your Energy Use

Sometimes the best way to avoid a power problem is to understand how you’re using electricity in the first place. Energy monitors can help you spot wasteful devices or habits, giving you the chance to cut back where it counts. They’re also great for figuring out which appliances you’d need to prioritise during an outage.

5. Be Ready for the Worst

Not every solution needs to be high-tech. A solid emergency plan can save you a lot of hassle. Keep torches, batteries, and power banks within reach, and make sure everyone in your home or workplace knows what to do when the power cuts out. Clear instructions go a long way in reducing panic.

6. Fix What’s Broken

Old or poorly maintained wiring can be a hidden cause of outages. If your home or office has seen better days, it’s worth getting a licensed electrician to inspect and upgrade your setup. Sometimes the simplest fixes—like replacing a worn-out switchboard—can save you from avoidable power problems.

Take Back Control

Blackouts don’t have to stop you in your tracks. With a bit of preparation and the right tools—starting with a UPS—you can stay ahead of outages and keep life moving, even when the power doesn’t.

Conclusion

The analysis of NSW power outage data highlights a critical need for Uninterruptible Power Supply (UPS) systems in both residential and commercial settings. Frequent outages, exacerbated by environmental factors and aging infrastructure, strain businesses and households alike. Regions such as the Central Coast and Lake Macquarie are particularly vulnerable, with outages affecting large proportions of their populations and businesses.

Investing in a reliable UPS solution is not just a precaution but a necessity for maintaining continuity, protecting valuable assets, and minimising downtime. For businesses, a UPS system safeguards against revenue loss and customer dissatisfaction. For households, it provides peace of mind and comfort during unexpected disruptions.

Contact Us Today

PSS has distributed Uninterruptible Power Supplies for 30 years and offers a broad range suitable for every application. Call us at 1300 882 447 or email [email protected] to find the right solution for your needs.

Effortlessly Monitor and Manage Your Power Supply with UPSilon 2000

In today’s world, continuous power is essential to maintaining critical operations. The Enduro Series UPS by PSS Distributors provides reliable protection, but to maximize its performance, monitoring and control are key. Enter UPSilon 2000—the ultimate software solution for managing your UPS systems. 

Real-Time Monitoring at Your Fingertips

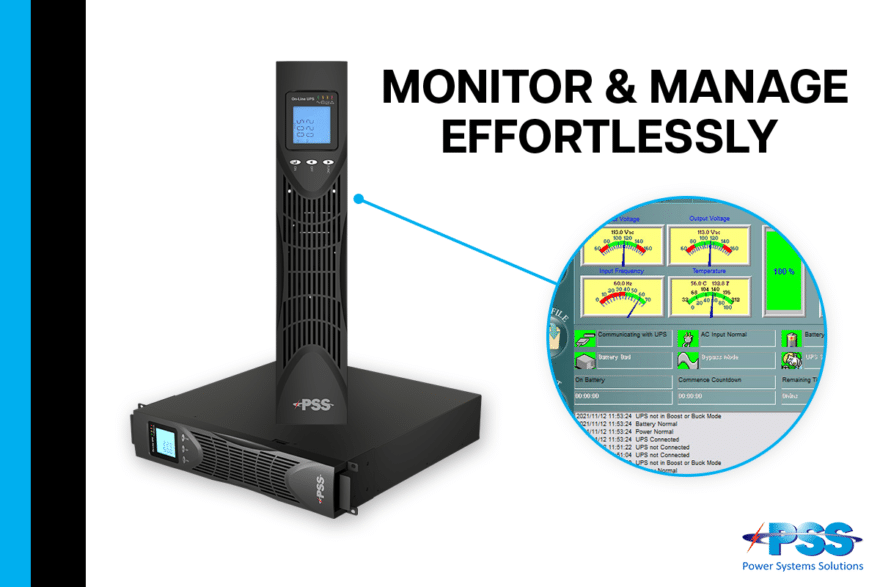
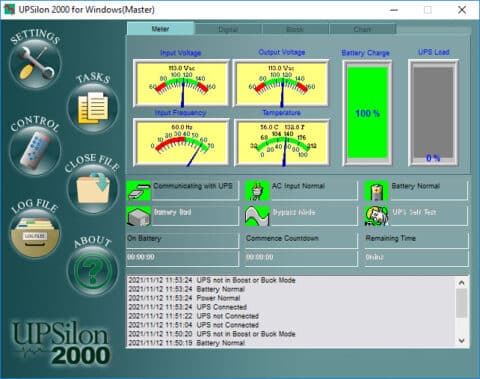
With UPSilon 2000, you gain access to a comprehensive view of your UPS’s performance. Whether it’s the input and output voltage, line frequency, load levels, temperature, or battery capacity, the software displays these metrics both digitally and graphically. Plus, when your power is running smoothly, the UPS status is displayed in a clear, analog diagram, ensuring at-a-glance understanding. 

Seamless Remote Monitoring

What if you could check your UPS from anywhere? UPSilon 2000 makes this possible. Through TCP/IP or the Internet, you can monitor your UPS remotely, offering peace of mind that your systems are operating optimally, even when you’re off-site. No more guesswork or manual checks—everything is handled effortlessly through remote access. 

Instant Notifications for Critical Issues

Don’t wait until it’s too late. UPSilon 2000 automatically detects crucial events like AC power failures or low UPS battery levels. When these conditions arise, the software springs into action, sending warning messages directly to your email, ensuring you’re always in the loop, no matter where you are. 

Comprehensive Compatibility

UPSilon 2000 supports Windows NT and its Service function, offering seamless integration with existing infrastructure. This allows you to manage your power systems efficiently without worrying about compatibility issues. 

Stay Ahead of Power Failures

With UPSilon 2000 paired with the Enduro Series UPS, you’re not just protecting your equipment; you’re managing power proactively. Stay informed, stay in control, and ensure uninterrupted operations with this powerful monitoring tool. 

Take Control of Your Power Systems

Why leave your power to chance? Enhance your UPS management with UPSilon 2000 and experience a new level of control and peace of mind. Ready to get started? Contact PSS Distributors today to learn more about how UPSilon 2000 can optimize your power systems. 

Ensure Uninterrupted Power Today!

Don’t wait for a power failure to disrupt your operations. Take control with UPSilon 2000 and maximize the performance of your Enduro Series UPS. Experience real-time monitoring, remote access, and instant notifications to keep your systems running smoothly. Ready to protect your critical operations? Contact PSS Distributors now and discover how UPSilon 2000 can revolutionize your power management!


Powering Reliability – Energy Testing of the Vacc-Safe PowerGuard Fridge with Integrated UPS

In the medical industry, maintaining the precise temperature range for refrigerated vaccines is not just important—it’s critical. While some fluctuations in temperature are inevitable, what matters most is that these fluctuations remain within the safe range of 2 to 8 degrees Celsius. Any deviation outside of this range can compromise the efficacy of these life-saving materials. That’s why at PSS, we’ve integrated a UPS system directly into our Vacc-Safe PowerGuard Fridge, ensuring that your vaccines remain safe, even in the event of a power failure. But we didn’t just stop at design; we rigorously tested our fridge to confirm its reliability. Here’s what we found.


Testing Overview

Our energy tests began with the Vacc-Safe PowerGuard Fridge at room temperature. Over a controlled period, we monitored its energy consumption as the fridge brought its internal environment down to the crucial range of 2 to 8 degrees Celsius. This phase is particularly important because it simulates real-world conditions where the fridge might be operating for the first time or after an extended period of being offline.


Maintaining the Perfect Temperature

Once the fridge reached the target temperature range, we allowed it to stabilize. To assess its performance under realistic conditions, we introduced a common but significant variable—opening the fridge door. At the end of the testing period, just before 8 AM, we opened the door to observe how the fridge responded in terms of energy consumption and temperature fluctuation.

Our tests specifically measured how much energy was required to maintain temperature stability after this disruption. The results were promising: even with the door being opened, the integrated UPS ensured that the fridge continued to operate smoothly, with only a minimal increase in energy consumption, and crucially, the internal temperature remained within the safe range.


Reliable Performance

Throughout the entire test, from the fridge’s initial cooling phase to the final door opening, the Vacc-Safe PowerGuard Fridge demonstrated exceptional stability. The integrated UPS system provided a seamless transition during simulated power interruptions, ensuring that the fridge’s internal temperature remained within the safe range at all times.


Why This Matters

In the healthcare industry, maintaining the correct temperature range can have serious consequences. Vaccines and other temperature-sensitive materials must be stored within strict parameters to maintain their effectiveness. The Vacc-Safe PowerGuard Fridge, equipped with an integrated UPS, not only meets but exceeds these requirements, offering peace of mind to healthcare providers.

Our energy testing confirms that this fridge is not just another piece of equipment—it’s a critical part of your vaccine storage strategy. When every degree within the safe range matters, trust Vacc-Safe to keep your materials protected.


Ready to Learn More?

If you’re interested in how the Vacc-Safe PowerGuard Fridge can support your medical practice, see more information here or don’t hesitate to contact us. Our team is ready to help you find the best solutions for your needs.
 

Ensuring Reliable Power Supply for NDIS High Physical Support Homes with UPS Systems

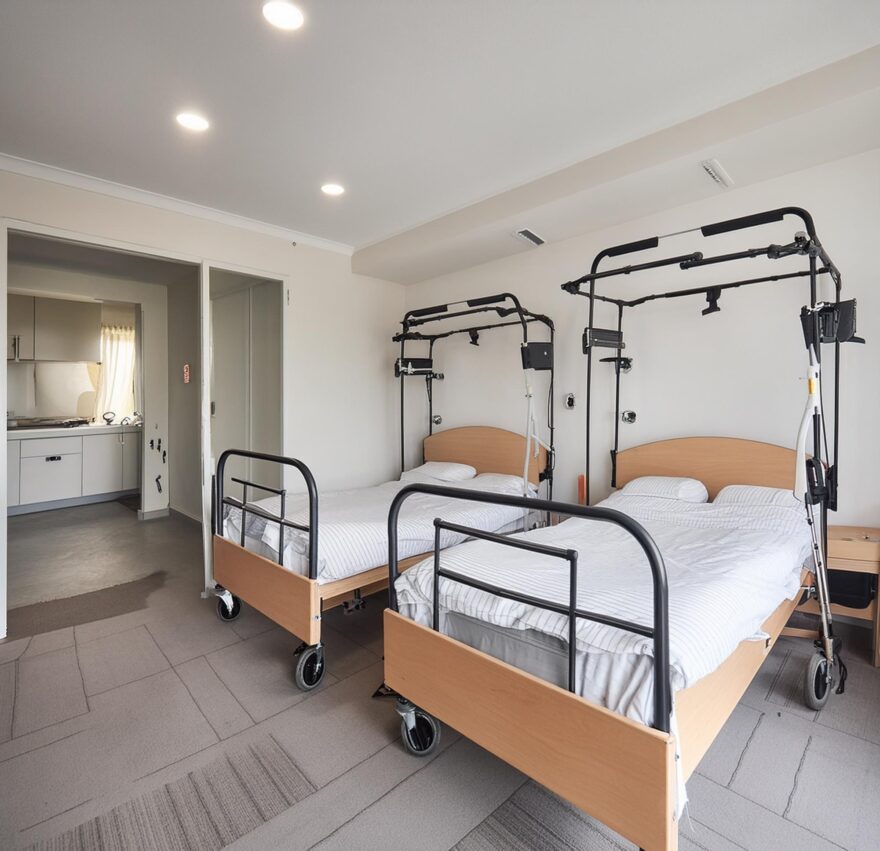
When building a high physical support house, ensuring a reliable battery backup system is critical. Uninterruptible Power Supply (UPS) systems in these homes are essential to guarantee that vital devices such as medical equipment, emergency doors, and communication systems continue to function during power outages. For NDIS high physical support homes, this reliability can mean the difference between safety and disaster.


The Role of UPS Systems in NDIS Homes

Power disruptions are more than just inconveniences in NDIS high physical support homes; they can lead to equipment failure, data loss, and even compromise the safety and well-being of residents. Critical devices such as ventilators, communication systems, and monitoring equipment require a continuous power supply to function properly. Any interruption can have severe consequences.

UPS systems provide a reliable and immediate solution to these challenges. They act as a safety net, kicking in the moment a power disruption occurs, ensuring that all essential devices and systems remain operational. This uninterrupted power supply is crucial for maintaining the standard of care and support that NDIS high physical support homes promise to their residents.

Key Benefits of UPS Battery Backup for NDIS Homes

  1. Continuous Power Supply: UPS systems ensure that there is no gap in power supply, keeping essential medical and operational equipment running seamlessly.
  2. Protection Against Power Surges: They safeguard sensitive equipment from power surges and spikes, which can cause damage and result in expensive repairs or replacements.
  3. Enhanced Safety: With UPS systems in place, safety devices like emergency lighting, alarms, and security cameras remain functional during power outages, providing a secure environment for residents and staff.
  4. Handling Induction Loads: PSS UPS systems are designed to handle induction loads, making them ideal for equipment such as emergency doors and other inductive devices that are critical in NDIS high physical support homes.

Why Invest in a UPS System for NDIS High Physical Support Homes?

  • Reliability: A UPS system guarantees that power interruptions do not affect the reliability of the care provided. This is particularly vital in homes where residents depend on life-sustaining equipment.
  • Cost Efficiency: By preventing damage to expensive medical equipment and avoiding data loss, UPS systems can save NDIS homes significant costs related to repairs, replacements, and downtime.
  • Peace of Mind: Families and staff can rest assured that the facility is well-prepared for power outages, ensuring that the residents’ well-being is never compromised.
  • Regulatory Compliance: Implementing UPS systems helps NDIS homes meet stringent regulatory standards, demonstrating their commitment to providing safe and reliable care.


Choosing the Right UPS System with PSS Distributors

At PSS Distributors, we specialize in providing high-quality UPS solutions tailored to the needs of NDIS high physical support homes. With over 30 years of experience and a deep understanding of the unique requirements of these facilities, we offer a range of UPS systems designed for maximum reliability and efficiency.

Our team of experts is ready to help you select and install the right UPS system to ensure continuous power supply and protection for your residents and equipment. We provide comprehensive support from consultation to installation and maintenance, ensuring that your UPS system performs optimally.
Conclusion

In NDIS high physical support homes, ensuring a reliable power supply is a critical aspect of providing safe and effective care. A UPS battery backup system from PSS Distributors offers the peace of mind, reliability, and protection needed to keep these homes running smoothly, even during power disruptions. Learn more about our UPS solutions for NDIS homes and contact us for a consultation when building a NDIS home.


Sustainable Steps: How we are being more Environmentally Conscious.

In today’s world, environmental sustainability isn’t just a buzzword—it’s a responsibility that businesses must embrace. At PSS, we take this responsibility seriously, striving to minimize our environmental footprint at every opportunity. Here’s how we’re making a difference:

Transitioning to Eco-Friendly Packaging

We’re constantly striving to improve our environmental practices, which is why we’re excited to announce our transition to eco-friendly boxes. Our new packaging features cardboard materials instead of glossy plastics, reducing waste and making it easier for customers to recycle. It’s a small change with a big impact—one that reflects our ongoing commitment to sustainability. Below is how we are managing this with our various brands:

UPS Packaging

One of the first steps we’ve taken is to rethink our packaging materials. Our UPS units now come with minimal to no plastic packaging. By minimising plastic usage, we’re not only reducing waste but also lessening our dependence on non-biodegradable materials. It’s a small change that makes a big difference.

Foam-Free Racks

In addition to reducing plastic, we’re also committed to eliminating unnecessary packaging materials. The majority of our racks now come with foam-free packaging, ensuring that we’re not contributing to the proliferation of foam waste. It’s a small change that aligns with our larger sustainability goals.

Patriot Power Supplies by PSS Distributors

is also making strides in sustainable packaging. We’re proud to announce that most Patriot power supplies are now shipped in recyclable packaging, and we are committed to transitioning the remaining products to fully recyclable packaging by the end of 2025. This initiative underscores our dedication to reducing environmental impact across all brands.


All UPS, Redback racks and patriot power supplies that have already moved towards fully recyclable packaging come labeled to assist all staff in making he right choices when disposing of packaging

Battery and Cable Recycling

At PSS, we believe in taking responsibility for our products throughout their lifecycle. That’s why we offer battery and cable recycling services to our customers. By facilitating the proper disposal and recycling of these items, we’re helping to divert hazardous materials from landfills and promote the reuse of valuable resources.

Cardboard Recycling Across Warehouses

last but not least, sustainability isn’t just about the products we sell—it’s also about how we operate as a company. That’s why we’ve implemented cardboard recycling programs across all our warehouses. By recycling cardboard packaging materials, we’re reducing waste and conserving valuable resources, all while setting an example for responsible corporate citizenship.


At PSS, environmental consciousness isn’t just a trend—it’s a core value that guides everything we do. From reducing plastic waste to promoting recycling initiatives, we’re committed to making a positive impact on the planet. Join us in our journey toward a more sustainable future. Together, we can make a difference.

What are you doing to lead the way in Environmental Responsibility?

Why you need a UPS do you need for your NDIS equipment?

Emergency power solutions such as a UPS are required to provide backup to life support systems for a minimum of 2 hours.

Life support systems are generally plugged into a double or single GPO and can include equipment such as; automated doors, breathing apparatuses, hoisting equipment and other medical devices.

NDIS-emergency-power-back-up-guidelines

*Excerpt from the SDA Design Standards.


PSS Distributors have worked alongside engineers installing into NDIS facilities to ensure all UPS meet the specifications and are suitable for the lifesaving equipment.

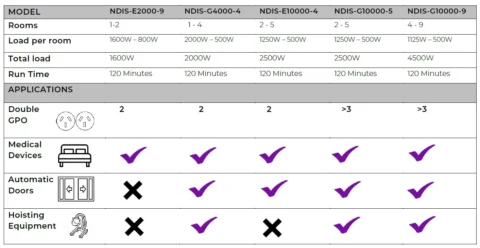
PSS has a range of UPS to suit NDIS home applications. UPS run times are all in line with NDIS specifications – 2 hours at a specified load. At PSS we have made the selection of your NDIS UPS easy, with the guidance of the table below:

Which UPS you need to your NDIS equipment - easy table


All systems can be customised to suit individual sites, specific applications or run times. Above covers standard applications, if these are not suitable, please get in touch with our technical team.

For further information please see our NDIS page:


*Specifications may change without prior notice *It is the responsibility of the installer to ensure all NDIS legal and moral obligations are met

The Redback Rack difference- Why our enclosures are superior!

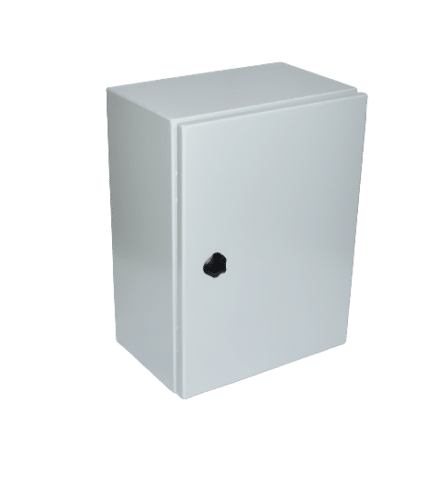
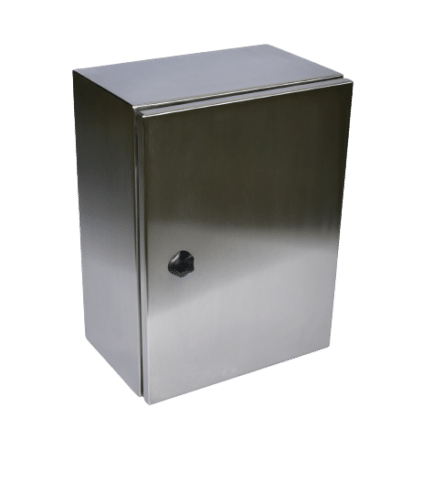
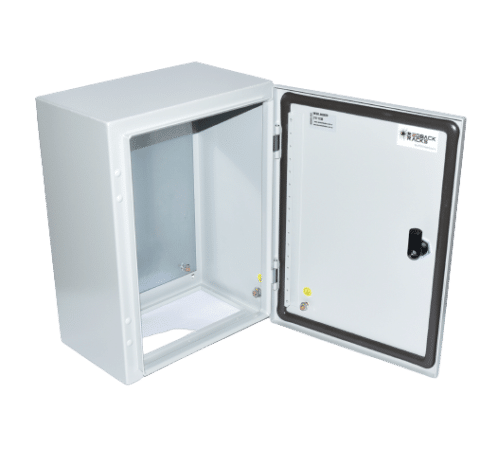
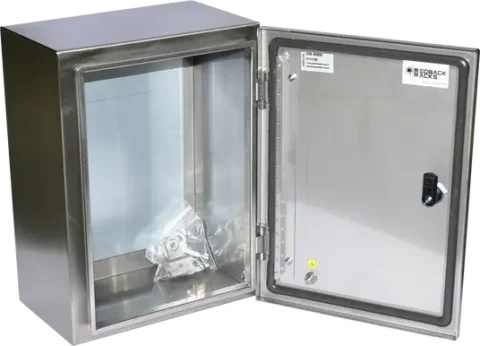
Our Weatherproof enclosures (MSB) and our stainless-steel enclosure (SSB) are new and improved. We have taken all the great features of our original GB range and made some great improvements. Both these enclosures have various features that give us the point of difference.


outdoor enclosure closedssb-removebg-preview

Manufactured in Europe – Both of the mild steel and stainless-steel enclosure are designed in Australia and made in Europe.

IP66 rating – Both of our enclosures are protected against heavy water from any direction and is totally protected against dust.

IK10 rating – Protected against heavy impact – making these vandal-resistant (up to 20 joules).

Discreet with no external branding – It is common for sites to require no external branding.

Reversible door – adjustable to your requirement, the MSB unit is reversed by mounting the door on the opposite side with hinges conveniently on both sides. The SSB is easily reversed by rotating the unit 180 degrees.


mild steel weather proof enclosure


1.5mm thick material – Both units are manufactured at 1.5mm thick, making them superior to many others on the market that are often 1 – 1.3mm.

Polished Stainless Steel 316 (SSB enclosures only) – A high resistance to corrosion.

Powder coated mild steel (MSB only) – Used to prevent corrosion.

Mounting plate pre-installed – This will make it easy to set up your equipment

Clinch nuts (SSB only) – This will make it 100% sealed from anything external coming in.


We have a range of accessories available, which are new and improved-

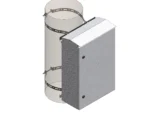
Pole clamps The pole clamps available are easy to install and fully adjustable, suited to pole diameter of 100mm to 300mm and able to hold weight up to 150Kgs. The pole clamps for the mild steel enclosures are galvanized/zinc and the pole clamps for the stainless steel enclosures are manufactured with stainless steel 316 material.

MSB & SSB Pole clamps

Vented doors Our vented doors are a new and improved method of adding vents to the units, the doors are IP54 and are easy to change over. Vented doors are available with mild steel enclosures only.

Keys Chromed key locks are available for both units and are easy to change over, these are a very popular accessory which are sold with the majority of enclosures

STP-K2-2 Keyed lock for MSB SSB


If you’d like to arrange a sample for your branch to see the quality for yourself or for more information on these units, please contact us.

What is an SMNP card?

An SNMP (Simple Network Management Protocol) is an easy way to monitor your UPS remotely. An SNMP will help keep a finger on the pulse of your UPS sending you SMS, emails or push notifications on its performance.

The SNMP card is designed to measure and collect data on all aspects of your UPS, functions of the SNMP will vary depending on the capabilities of the UPS, these functions may include:

  • Temperature
  • Input and output voltage
  • Battery capacity of your UPS
  • Shutdown of UPS if AC power is not present

An SNMP card is one of the most important accessories you can purchase with your UPS. You will have full access to monitoring the health of your UPS and troubleshooting a solution remotely. This is a vital tool that can save you work in the long run.

We offer a range of SNMP cards that can help you keep on top of your monitoring. All our UPS’s (excluding our Eco-Alto) are compatible with our SNMP cards.

For more information, please get in touch with us on which SNMP card is suitable for your UPS.

We offer free training on all products!!!

PSS offers free training to all customers on any of our products.


We believe knowledge is power and training equips our customers with the tools to increase their sales.

With product presentations and examples of physical products, our training is educational and hands on.


Training will be tailored to suit your staff’s knowledge level, whether you’re a beginner with power and data racks or been working with them for a while and would like to brush up your skills and become more advanced, we’ve got you.


Training is available nationwide, in person or online. Get in touch now to book your training session.

Wrapping up the end of financial year

To our customers and well-wishers!

We’ve blinked and here we are at the end of the Financial Year 2021 – 2022.   We would like to take this opportunity to thank all of you for an amazing year.

Over this past year we have added staff, new clients, increased our stock holding, set up warehouses and although we are a small business – we can safely say we are a mighty one. We have had our challenges like every business over the last two years, but we can also proudly announce that FY21-22 we have had our largest growth. No matter what the economic climate has been, we have persevered together as a team and came out stronger.

The success of PSS Distributors is based on the relationships we have built over the years, and we really wouldn’t be where we are without you. We are grateful for the opportunity to work with, and for you. Our passion for helping our clients with strong customer service has always been our priority and always will be.

As the end of year approaches, we know there will be many challenges ahead. But we are so excited with what 2022 – 2023 has in store for us – enthusiasm and anticipation are building around new opportunities in all our locations nationwide. Stay tuned for more details in the new year.

Working together this past year has been a pleasure and we’re proud to have you all with us. We look forward to a successful year working together!

From the whole team at PSS Distributors.

We are proud to be celebrating Australian made week!!!

Australian made week is a campaign running from 6 – 12th of June 2022, the week is all about celebrating everything Australian made.

Picture of Australia to celebrate Australian made week

At PSS we endeavor to have product lines of Australian made products available, while maintaining cost effective and practical ranges.

We have put together what we think the advantages of supporting Australian made products are:

  • Designed in Australia, for Australia, with your needs in mind.
  • Supports the local economy.
  • Great customer service.
  • More customisation to products.
  • Local products are manufactured to Australian standard and use local quality checks.
  • Open communication with manufacturers.
  • Reduced delivery costs.
  • Faster lead times.
  • Less transport reduces emissions and helps to save the environment

Aus made products to celebrate aus made week

Some of our Australian made products.

What are you purchasing this week that was Australian made?

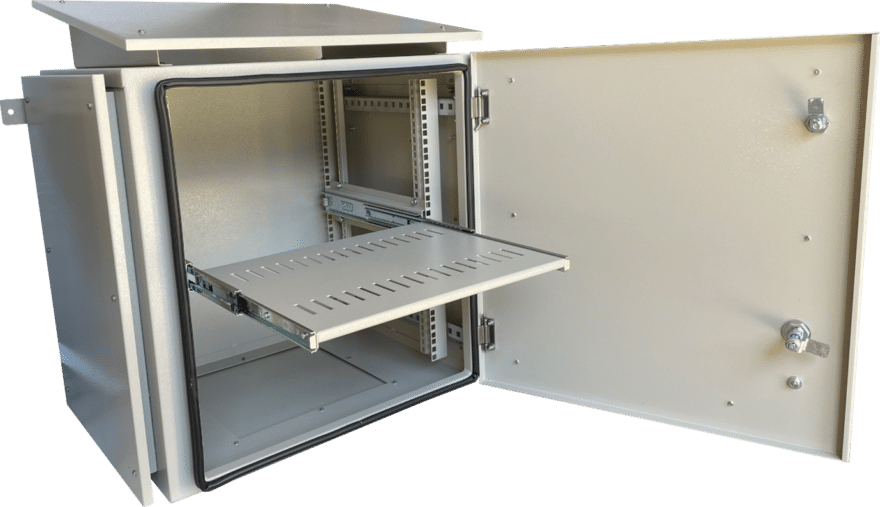
Custom build outdoor racks designed for security systems

When security is essential for sensitive equipment being installed outdoors, Redback Racks make it happen!

Starting with the requirements needed, we get customers to fill in our enquiry form and then we get to the drawing board with our local manufacturer and make it into reality.

Below is a roll out that was done for a mining customer, to keep all CCTV systems running and safe.

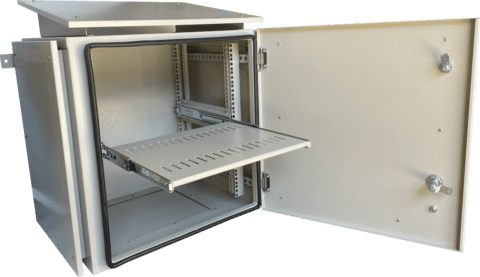
Outdoor custom build with sunshields and sliding shelf

This rack has a 2-point locking system guaranteeing IP integrity is maintained. Sloped rain hood ensuring maximum water runoff and sunshields protecting the rack from direct sunlight and keeping internal equipment cooler.

For all enquiry’s please fill in our online form and we will get back to you.


OUR PROJECTS NATIONWIDE…

PSS are proud to share a selection of our projects which have been completed in the last year.

PSS is proud to share our projects

Victoria

PSS Distributors are proud to support Victoria Health in providing UPS systems for the current COVID – 19 rollouts.

Vic Health have selected our Medi – X 5 to provide medical refrigeration across sites organised by the State Government.

Our Medi – X 5 is an easy plug and play design, which assists the sites in a quick rollout. This unit comprises of a 2kva UPS, along with battery bank for extended run time.


New South Wales

We have just supplied units to the NRL,  they were requiring back up and the units supplied were the PMU-10, PMU-20X and an EN3000.  These units are perfect for camera surveillance, gates, telephone systems and more heavy duty for those larger applications.


Western Australia

We have supplied and commissioned units for Rockingham Hospital, they were after reliable and efficient units that could support their large requirements and we were able to offer the E-Power range.

The EP series offer varying run times and is perfect for any application that required a high level of reliability including remote industrial sites.


Queensland

PSS Distributors has been selected for various NDIS locations to provide battery back up to critical equipment with their UPS systems, proudly supporting the National Disability Insurance Scheme.

PSS has used their GP range across all sites, best known for its reliability, it is specifically designed with a Galvanic Isolation Transformer for the medical industry. The specification has been checked before installation by engineers and the NDIS, passing every time.


For more information on projects we cover, please contact us.

What is an Anderson plug connection?

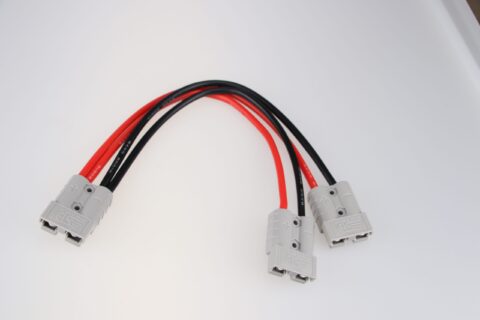
An Anderson plug connection is used to provide a safe and efficient power source for DC (direct current) circuits, it is a heavy-duty connector which looks like this:

What is an Anderson plug connection

The Anderson connection is most used in caravans, campers, and tow vehicles. At PSS we use Anderson connections to connect our EBM (external battery modules) to the UPS, this provides power and charge to the EBM.

UPS that are purchased with EBM are supplied with the Anderson connection for the UPS and the EBM’s. The Anderson’s can be connected to the UPS and EBM on site, but this is generally done by a technician at PSS before being shipped out. On site the Anderson plugs will just need to be plugged into the reciprocal Anderson, via plugging negative into negative and vice versa

The Anderson charger on the UPS is customised to the number of EBM attached to the UPS for efficient timely re-charging of batteries.


anderson-positive into negative


If you have any further questions, please contact one of our technical staff.

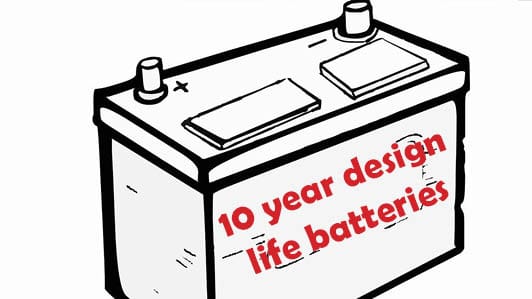
PSS now stocking 10 year life batteries at all branches!

PSS Distributors is happy to share that we now offer 10-year design life batteries on most UPS.

Our standard batteries are known as 5-year design life UPS batteries, to read more about the expected life span of those please click here. 

With an increased demand for longer design life batteries, we now offer these as an accessory in all UPS (excluding the Eco-Alto range). Stores nationwide now stock these batteries as a standard which makes assembly of these UPS a seamless process.

We are seeing the most demand for these long life batteries in the medical field and remote installations for critical site, this is usually sold in our Medi-X and GP range of UPS.

To read other blogs we have written about other long design life batteries, including lithium, Nickel-Cadmium UPS Batteries, Lithium Iron Phosphate UPS Batteries  click here.

For any further questions on the different type of batteries we offer please contact us.

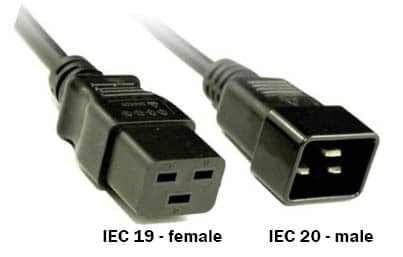
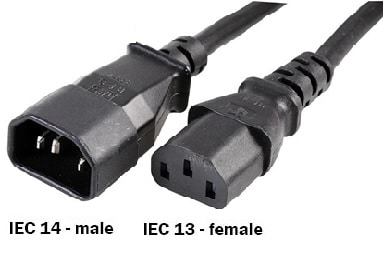
What is the difference between IEC plugs – C13, C14, C19 & C20

This information will cover the following connections – specific to Australian appliances:

  • IEC C13 at 10amps
  • IEC C14 at 10amps
  • IEC C19 at 16amps
  • IEC C20 at 16amps

Starting with IEC C13 and 14 at 10amps

IEC is a 3-pin power cable (L, N & E) used mainly for computer, communications, and other appliances.

IEC C13 is also commonly called a “kettle cord” and is the male connection that fits in IEC C14 – female. These are rated to a maximum of 10Amps.

IEC 13/14 are commonly used to power appliances; they plug in with a standard 10amp 240v plug.

At PSS Distributors, UPS 600va – 2.2kva use IEC 13 connection, making them an easy plug and play design.


IEC C19 and C20 at 16Amps

IEC 19 and 20 are still 3 pin connections but slightly different to the 13/14 connection, IEC 19 and 20 connectors are designed to carry a higher current of up to 16amps. The different shape of the connectors ensure they cannot be connected together.


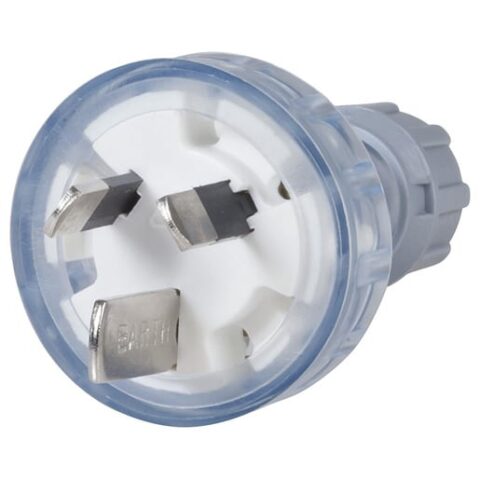
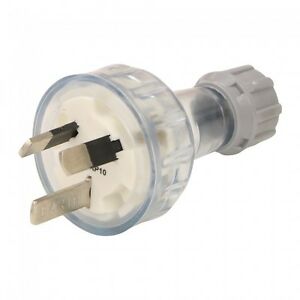
Often an appliance that draws over 10Amps and under 15Amps will come with a 15Amp AUS Standard 3 pin plug to a C19 for the input power.

15amp Aus plug

At PSS Distributors all our 3kva UPS use IEC C19 and are plugged into a 15 AMP socket. This is in line with Australian standards.

So, what is the difference between 10 AMP and 15AMP AUS standard plug?

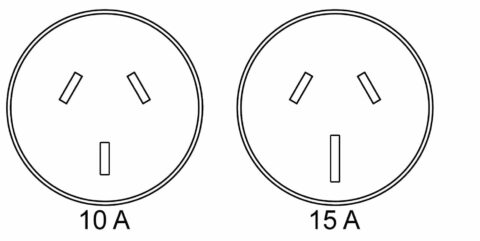
10 and 15amp are both single outlet, single phase circuits. However, 15amp has a heavy duty (thicker) wire to carry a larger current and the socket on a 15amp plug has a larger earth. 15amp plug needs to be plugged into a dedicated 15amp socket due to the larger earth, but a 10amp plug will fit into a 15amp socket, please see example below of the 10 and 15amp sockets.


Any UPS we sell above 4kva would need to be hardwired in by an electrician, this again is in-line with all Australian standards.

If you have any further questions about connection types, please get in touch with one of our technicians.

PSS Provides Backup to NSW Rural Fire Service

PSS Distributors is proud to have a UPS providing backup at NSW Rural Fire Service (NSW RFS).

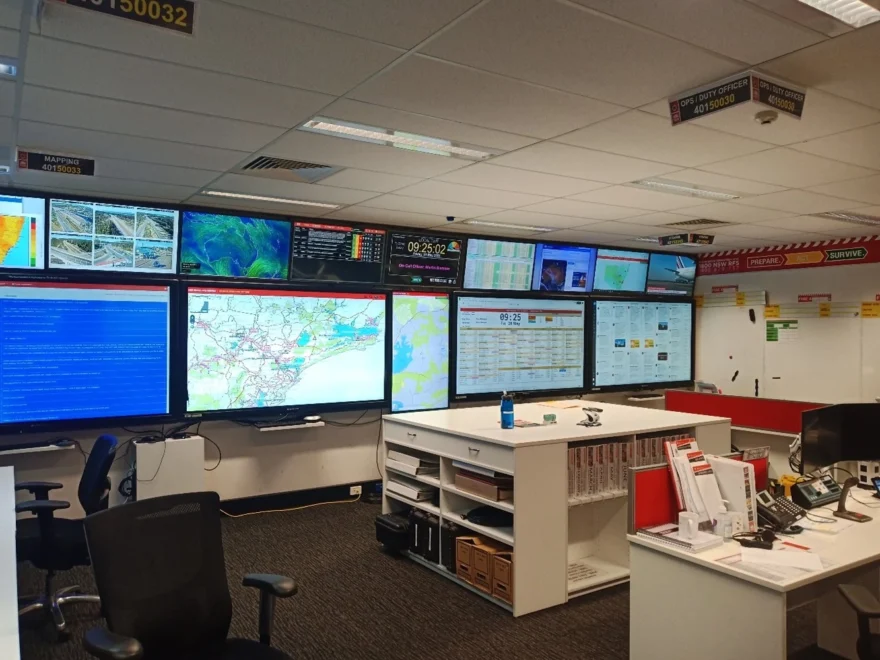
The NSW RFS is the lead combat agency for bush fires in NSW. PSS has used their PMU unit to provide uninterrupted online protection to the equipment at RFS (shown below).


A UPS in an integral part of emergency service operations, ensuring all systems have continuous power in times of need. PSS Service department is responsible for maintenance and repair on this unit and provides the RFS reliable support 24/7.


For any UPS or service quotes please fill out the contact form and one of our friendly staff will get back to you.

How to set UPSILON 2000 to send emails via Gmail


These are general steps to set up your UPSILON software to alert you via your gmail.

NOTE: This may require support from your IT provider.

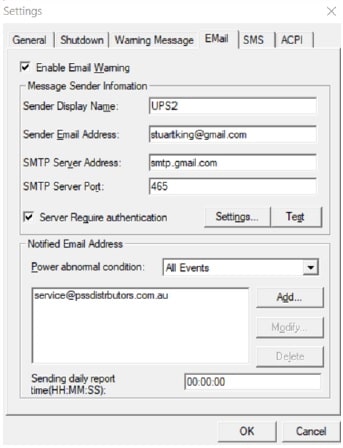
Settings > Email

1. Tick Enable Email Warning
2. Fill In desired Sender Display Name
3. Fill in desired Sender Email address
4. Use smtp.gmail.com for the SMTP Server Address
5. Use 465 for the SMTP Server Port
6. Tick Server Requires authentication
7. Select Setting

Figure 1


Settings > Email>Settings

1. Fill in desired your google account name
2. Use the Generated app password provided by Gmail NOTE – Your do not use your normal Gmail password
3. Tick Server Log on using Secure Password Authentication
4. Press OK
5. You will return to the screen (figure 1)
6. Select Test to verify email settings

upsilon setting up software with SW001 with email2

Figure 2


Generating a Gmail App Password

1. Go to App passwords (google.com)
2. You will need your normal Google credentials
3. On Select app drop down, scroll down to Other (Custom Name)
4. Type desired name – for example “UPS_1”
5. Select Generate
6. Copy password in Yellow box and paste into the Password in Settings>Email>Setting


Figure 3


If you have any other questions regarding setting up your UPSILON software please contact us

What can small businesses do to play their part in going greener?


There’s no denying we live in a world with too much waste, and we are all facing the real effects of climate change. At PSS we are playing our part to eliminate waste and become greener overall. These are the things we have made changes to recently:


    1. MSB and SSB packaging – our newest product (outdoor enclosures) uses the least amount of packaging and plastic yet; however, we still ensure safe and secure transportation – just avoiding huge waste of packaging.
    2. All stores have recycling facilities – All stores have an additional bin for recycling purposes to ensure the waste we do have is disposed of correctly. Staff are trained with the appropriate skills of discarding waste.
  1. We recycle all batteries – We recycle all batteries appropriately, recycling is an economical and environmental way to solve the problem of landfill and taking on a responsible stance.


  1. Try our best to minimise all plastic with orders – All storeman use the least amount of packaging when sending goods.


  1. Less paper overall – Moving into the generation of going green and understanding the need to participate in cleaning up the environment, we understand the small gestures that are so important; hence all invoices are sent via email at the close of every workday.


  1. Less local freight – we have increased storage facilities in all states to reduce local freight which reduces petrol and packaging and thus contributing to reducing our carbon footprint, all while helping customers save on freight costs.


Do you have any more tips for us? What are you doing to go greener in your workplace?

How to setup a server rack, successfully!

The steps below will take you through what to keep in mind when purchasing and setting up a server rack. We will go through where to keep it, what size to buy and useful accessories to consider.

Where?

Firstly, you need to consider your long-term placing of the server rack. At Redback Racks, all our floor standing racks come standard with castors and stabilising feet, it is always best practice to wheel your rack into a suitable position before setting up your equipment. Other things to keep in mind when deciding where to keep your rack include:

  • Accessibility
  • Heat
  • Noise

If you do not have access to a server room, you may want to consider an acoustic rack for noise reduction.

Size?

Now that you have found a place to keep your server rack you need to consider the size of the cabinet.

  • How much space do you have available?
  • How much equipment will you be storing in the rack?

To read more about selecting the correct size rack please click here.


Accessories

The last thing to consider when purchasing and setting up your server rack is the accessories you need with it.

All Redback racks come standard with cage nuts, shelves and castors/stabilising feet for floor standing racks or wall mounting brackets for the wall mount units. Other accessories you may need to consider are:

  • Ventilation – keeping your equipment at optimum temperature may extend the life and assist it running. Our ventilations options include a range of fans, digital monitoring units and aircons.
  • Cable management – We’ll let these images do the talking of advantages of cable management

Cables messy vs organised with cable management


If you have any other questions in selecting the correct rack, please contact one of our friendly staff.